
Appearance
Reports and Dashboards
Introduction
Beside the the browsing options available in the OpenStudyBuilder application, the system also supports NeoDash reports and dashboards. NeoDash provides interactive, read-only views over the OpenStudyBuilder graph database — for browsing biomedical concepts, comparing studies, inspecting the audit trail, and more.
This section explains how to open NeoDash, how to pick a report, and documents each available report. Every report page follows the same structure: Purpose, Concept & definitions, and When to use set the scene; Report tabs lists what each tab is for; each tab then has a Quick Guide with steps and screenshots; and Solution Architecture, Common errors, and Related topics round it off.
NOTE
These NeoDash reports complement the OpenStudyBuilder application but have some user-interface limitations (for example limited interactivity, filtering and formatting compared to native application features). Over time, the functionality they provide is intended to be moved into the OpenStudyBuilder application step by step, as native features become available.
Open NeoDash
To open NeoDash reports:
- Click on the Reports button placed on the main OpenStudyBuilder page

- The NeoDash login page should be displayed
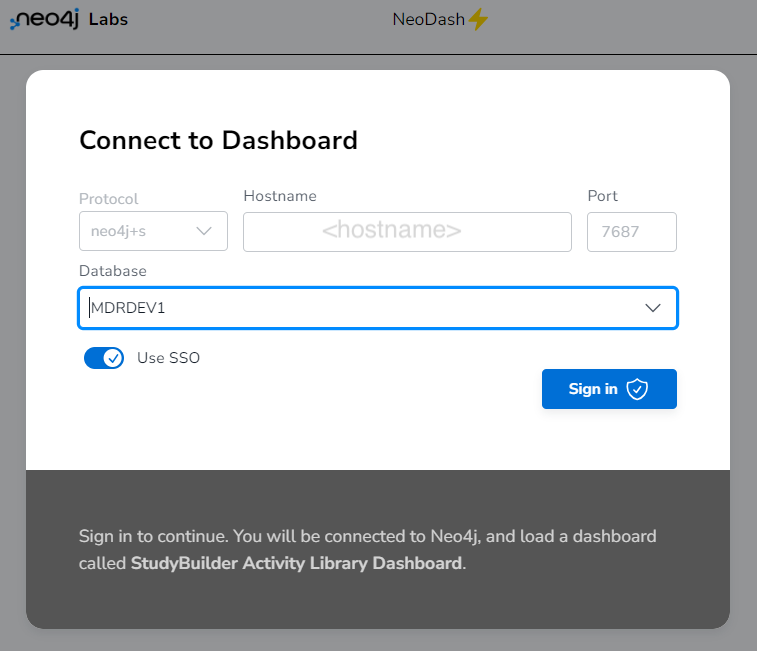
- Select to use 'SSO' and then click the 'Sign in' button.
IMPORTANT
Select the database in which the NeoDash report is stored. Typically a sponsor-provided name and not neo4j.
- If requested to select a browser account, select your Microsoft identity account you use for the application.
- The NeoDash report should open
NOTE
The URL to access the NeoDash report will follow this pattern, where text in '[ ]' is optional and italic text is replaced by environment specific values: [open]studybuilder[.environment].domain/neodash/
NeoDash interface elements
The report guides in this section refer to parts of the NeoDash interface by consistent names. The figure below labels every element you see when you open a report as a reader. Click the image to open it at full size.
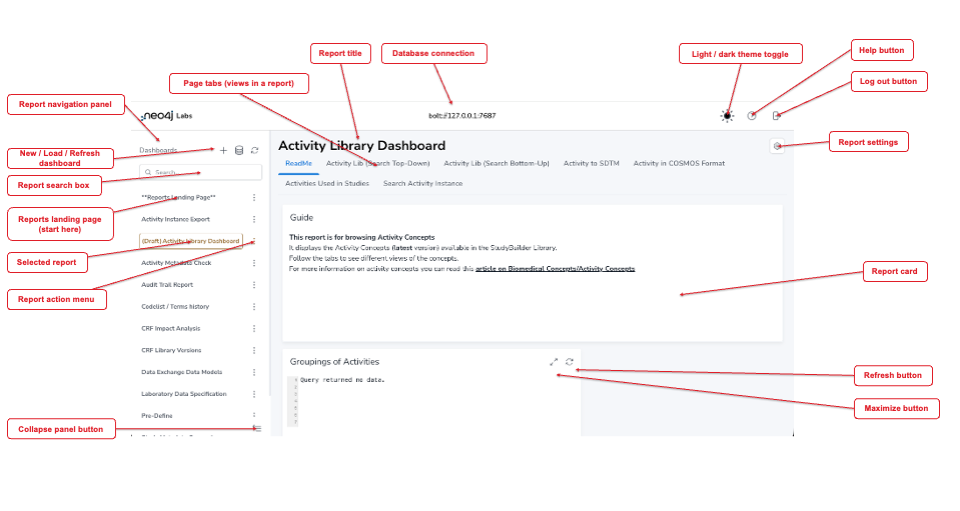
| Element | What it is |
|---|---|
| Database connection | The Neo4j database the reports read from. Read-only — you do not change it. |
| Light / dark theme toggle | Switches NeoDash between light and dark appearance. |
| Help button | Opens NeoDash help. |
| Log out button | Ends your NeoDash session. |
| Report navigation panel | The left-hand drawer listing every available report. (NeoDash calls each report a dashboard.) |
| Report search box | Filters the report list by name. |
| Reports landing page | The Reports Landing Page entry at the top of the list. Explains how to access the other reports (the expand/collapse menu) |
| Selected report | The report currently open, highlighted in the list. |
| New / Load / Refresh dashboard | Buttons above the list to create, load, or refresh a dashboard (mainly used by editors). |
| Report action menu | The per-report menu (⋮) with actions for that report. |
| Collapse panel button | Hides or re-expands the navigation panel. |
| Report title | The name of the report you have open. |
| Page tabs | The tabs across the top — each tab is a different view of the report. The first tab is always a short ReadMe. |
| Report settings | Opens settings for the current report. |
| Report card | A content box inside a tab that shows one query result (a table, chart, map, or text). Some guides also call this a panel. |
| Maximize button | Expands a report card to fill the screen. |
| Refresh button | Re-runs the report card's query. |
General features
A few controls behave the same way in every report, whichever one you open.
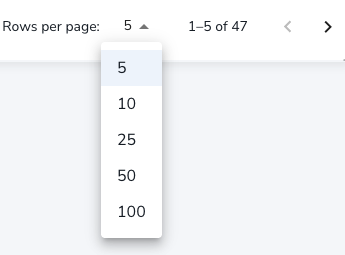
Rows per page — tables show 5 rows by default. Use the Rows per page dropdown below a table to show more (5, 10, 25, 50, or 100), and the arrows to move between pages. Unfortunately, it is not possible to change the default in the Report Settings.
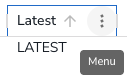
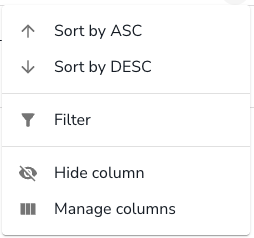
Sort, filter & manage columns — open a table column's menu (the ⋮ in the column header) to Sort by ASC / DESC, Filter the rows, Hide column, or Manage columns.
Download a table — click the download icon (a cloud with a down-arrow) on a table card to export its rows to a CSV file.

Maximize & Refresh — any report card can be expanded to full screen with the Maximize button and re-run with the Refresh button (see NeoDash interface elements above).
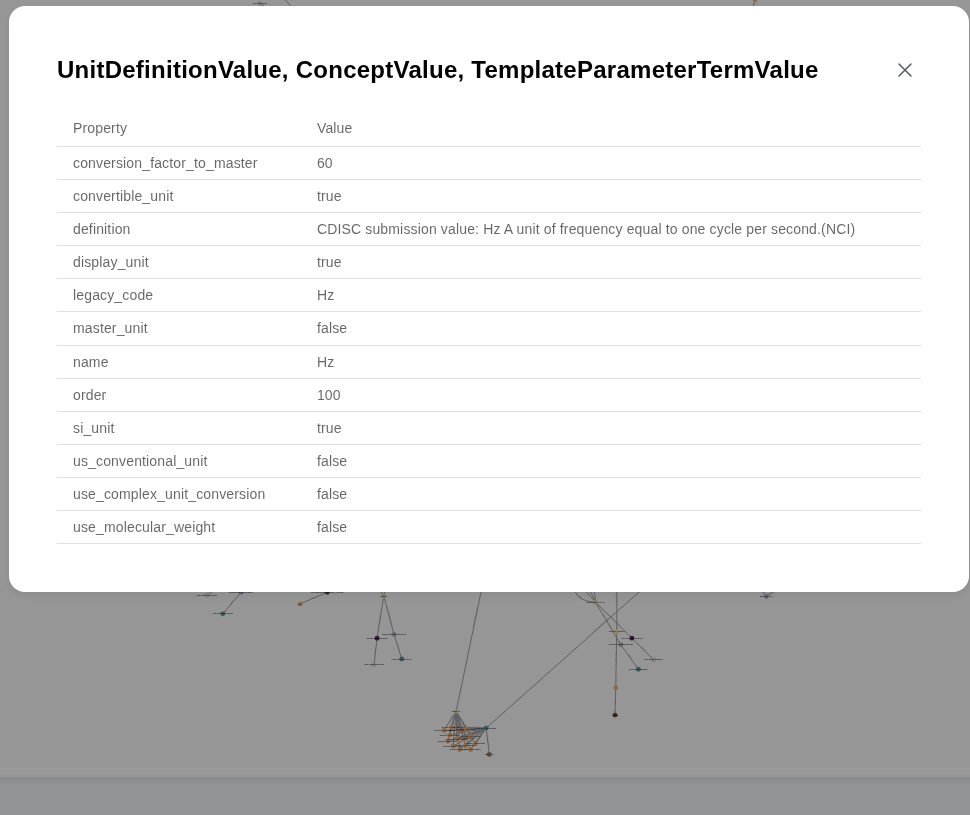
Inspect graph node properties — in a graph-view card, click a node to open a modal with a Property / Value table of everything stored on it.
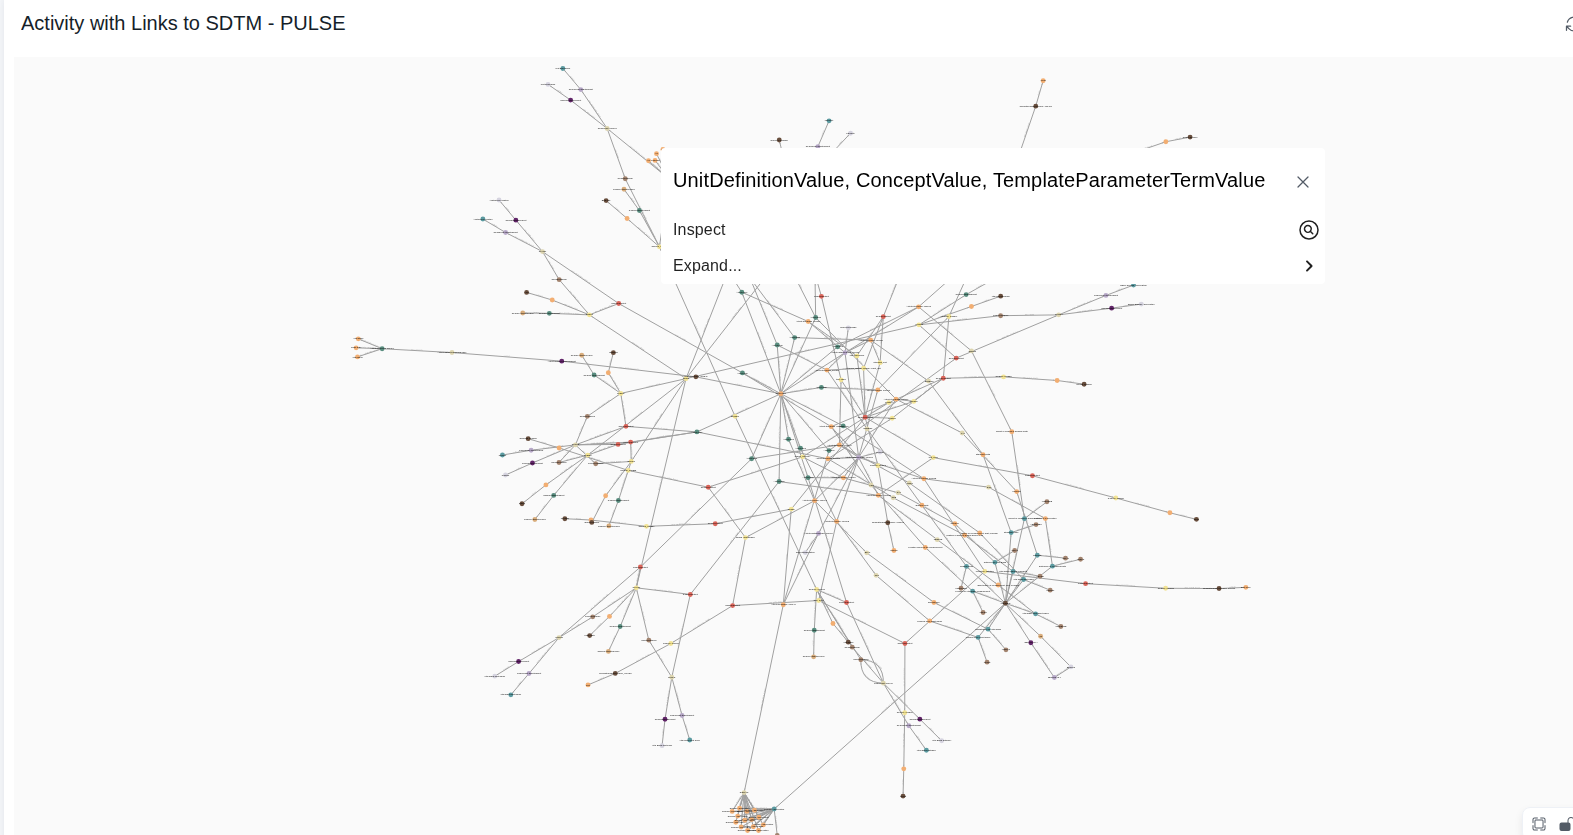
Right-click a node instead to open a context menu with Inspect (same property table) and Expand... (follow a relationship type from that node).
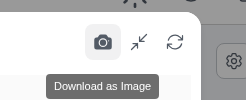
Download a graph as an image — maximise a graph-view card, then click the camera icon (Download as Image) next to Refresh to save the current graph layout as a PNG.
Select a report
In the lower left corner of the neodash window you will find the Expand  and Collapse
 icons for the Report navigation panel. Upon expanding the Report navigation panel, available neodash reports can be opened and reviewed.
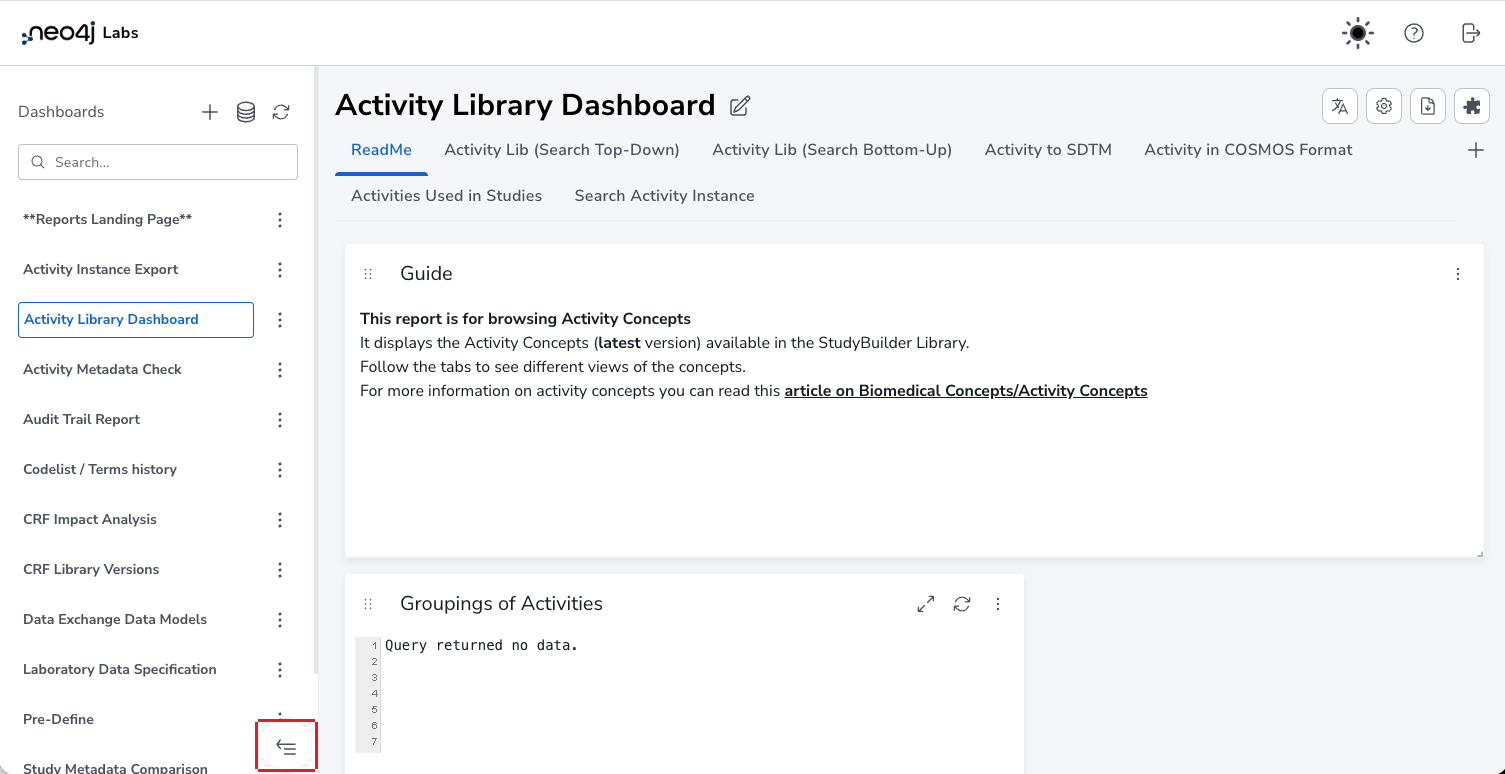
The first tab of each report holds a short ReadMe instruction as well.
Available reports
| Report | Purpose | Where to find it |
|---|---|---|
| Activity Library Dashboard | Browse and understand biomedical concepts (activities and activity instances) in the OSB Library from multiple perspectives. | Report navigation panel → Activity Library Dashboard |
| Activity Metadata Check | Check activity instances for missing items and valid groupings. | Report navigation panel → Activity Metadata Check |
| Audit Trail Report | Browse audit-trail history of changes to library elements and studies. | Report navigation panel → Audit Trail Report |
| CRF Impact Analysis | See which Forms, ItemGroups, and Collections would be affected by changing an Item, ItemGroup, or Form. | Report navigation panel → CRF Impact Analysis |
| CRF Library Versions | Compare versions of CRF collections, CRFs, Groups, and Items. | Report navigation panel → CRF Library Versions |
| Data Exchange Data Models | Browse CDISC and sponsor data-exchange data models. | Report navigation panel → Data Exchange Data Models |
| Laboratory Data Specification | Build a Laboratory Data Specification for a supplier. | Report navigation panel → Laboratory Data Specification |
| Study Metadata Comparison | Compare metadata between two studies or two versions of a study. | Report navigation panel → Study Metadata Comparison |
| Syntax Template Dashboard | Browse syntax templates, parameters, instantiations, and study usage. | Report navigation panel → Syntax Template Dashboard |