
Appearance
Activity Library Dashboard
Where to find it: Reports button → NeoDash → "Activity Library Dashboard" in the Report navigation panel. In the application, activities live under "Library" → "Concepts" → "Activities".
Purpose
Browse and understand the biomedical concepts (activities and activity instances) in OpenStudyBuilder Library from several perspectives — groupings, top-down/bottom-up search, SDTM mapping, CDISC BC/SDTM formats, and study usage — with closer-to-the-database access than the application provides.
Concept & definitions
In addition to the OpenStudyBuilder application (see image below), the Neo4j dashboard lets you browse and understand the biomedical concepts (activities and activity instances) in the OpenStudyBuilder Library. Some terms will be used also in the Neo4j dashboard:
- Activity — an "umbrella" defining the general attributes of a logical observation.
- ActivityInstance — the detailed specification of the observation, including context/qualifier values, ADaM/SDTM references, and other sponsor specific codes.
- Group / subgroup, class / sub-class — the dimensions activities are organised and searched by.
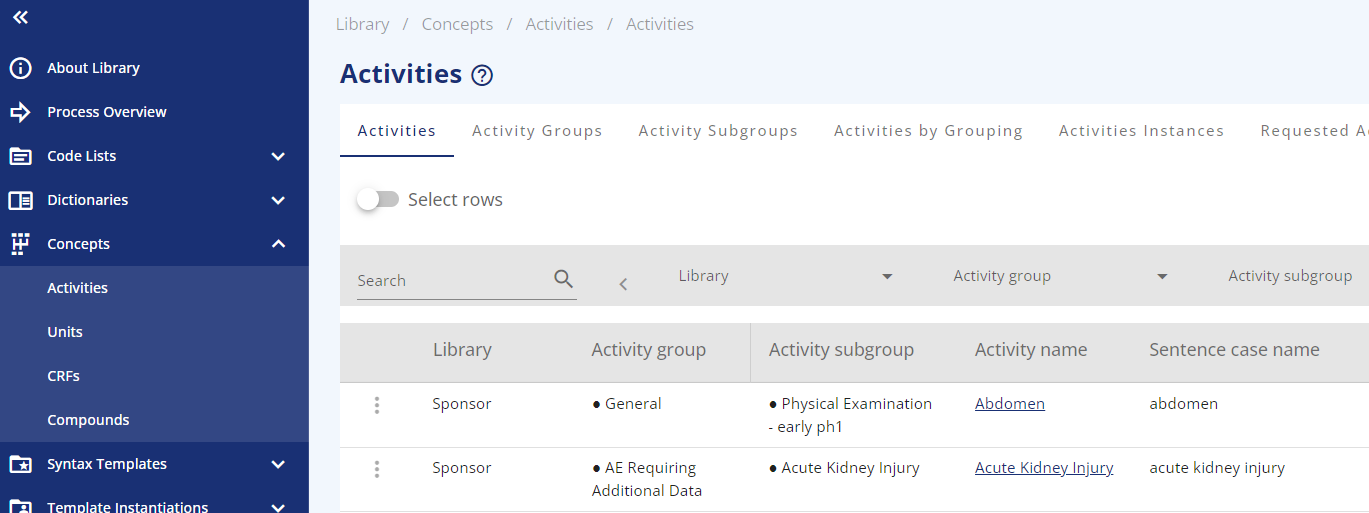
Activities are managed in groups and subgroups. Whereas the Activity is an "umbrella" defining the general attributes, the ActivityInstance is the detailed specification of the logical observation — including context and qualifier values, and internal unique identifications. This detailed specification enables unique identification of source data, representation in SDTM by several qualifiers, and representation in ADaM BDS by PARAMCD value.
When to use
Use when working with biomedical concepts (including CDISC BC and SDTM Dataset Specialization (SDTM DSS) formats) and you need a database-style view of activities (latest version), their groupings, instances, SDTM mapping, or study usage.
Report tabs
The dashboard is organised in different tabs, each supporting a different purpose. To open the report, see Open NeoDash on the section landing page.

| Tab | Use it to… |
|---|---|
| ReadMe | Get oriented — counts of activities and activity instances and how they are grouped. Start here. |
| Activity Lib (Search Top-Down) | Drill down class → sub-class → group → sub-group to find an activity and view its details and instances. |
| Activity Lib (Search Bottom-Up) | Start from one or more activities and see which groups and sub-groups they belong to. |
| Activity to SDTM | See how activities map to SDTM items for a chosen implementation guide. |
| Activity in CDISC Format | View an activity rendered as a CDISC BC Concept and SDTM Dataset Specialization, each as YAML and as a CDISC-Excel-style table. |
| Activities Used in Studies | See which studies use selected activities, broken down by visit. |
| Search Activity Instance | Search directly at the ActivityInstance level. |
ReadMe
Purpose: Gives an overview of the activities, their groupings and counting statistics.
When to use: Start here to get oriented before you drill into the other tabs.
Show Quick Guide
The first dashboard page gives an overview of activities, their grouping and the types including counting statistics.
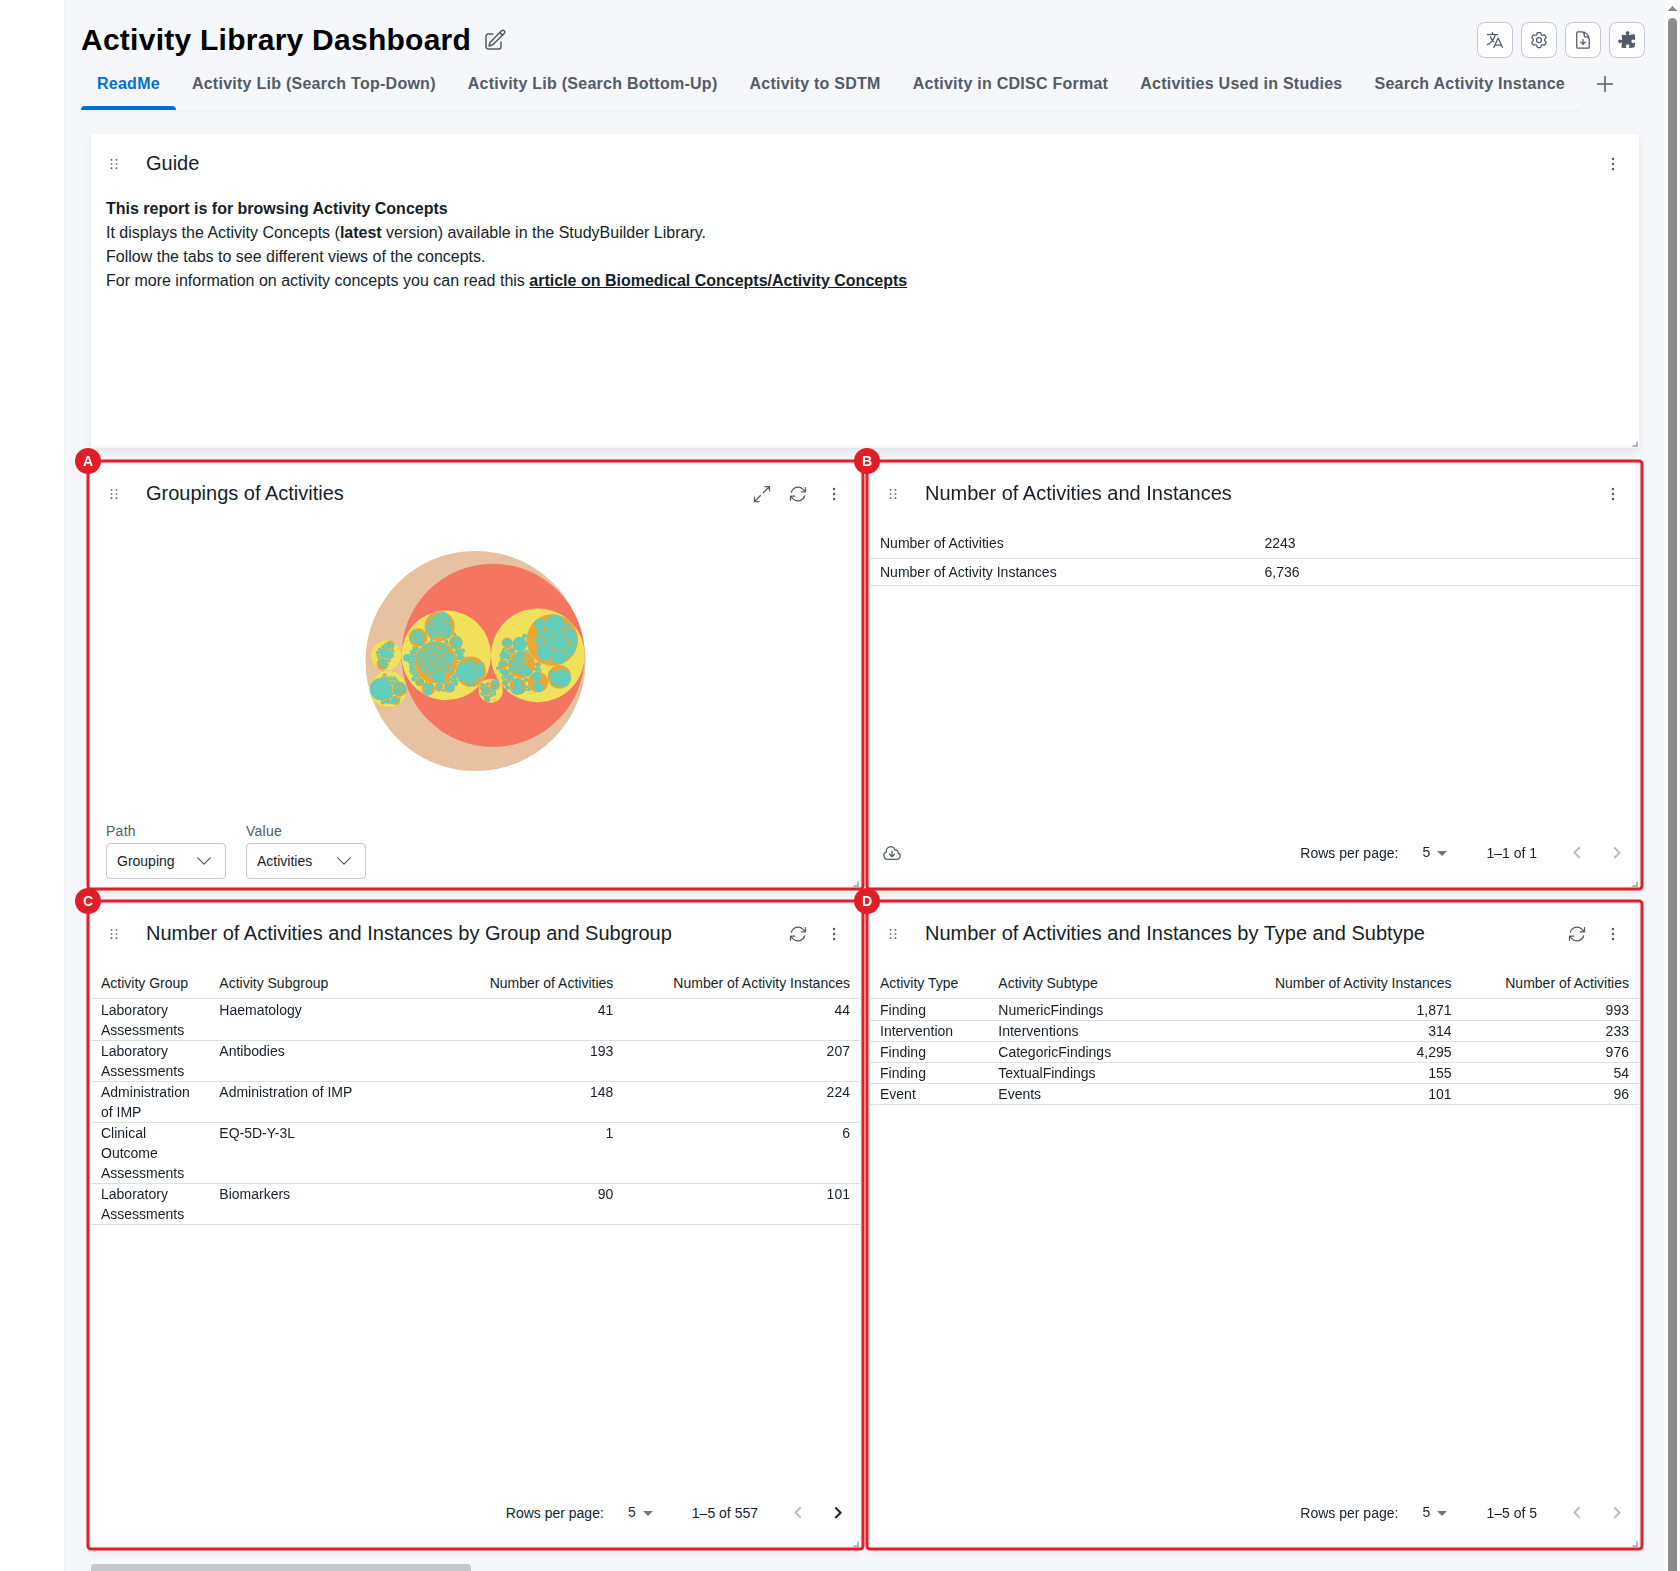
The first graphic (A), Groupings of Activities, is a circle-packing chart (nested circles) showing the available types and sub-types. Click a circle to drill down; click the Refresh button in the top-right corner of the report card to go back.
To the right, Number of Activities and instances (B) shows the totals (an instance is the specific definition of an observation used in studies). Two tables then break these down — by group and subgroup (C) and by type and subtype (D).
Activity Lib (Search Top-Down)
Purpose: Lets you drill down through class → sub-class → group → sub-group to find an activity and inspect its full definition and instances.
When to use: Use it when you know an activity's class or grouping and want to drill down to it.
Show Quick Guide
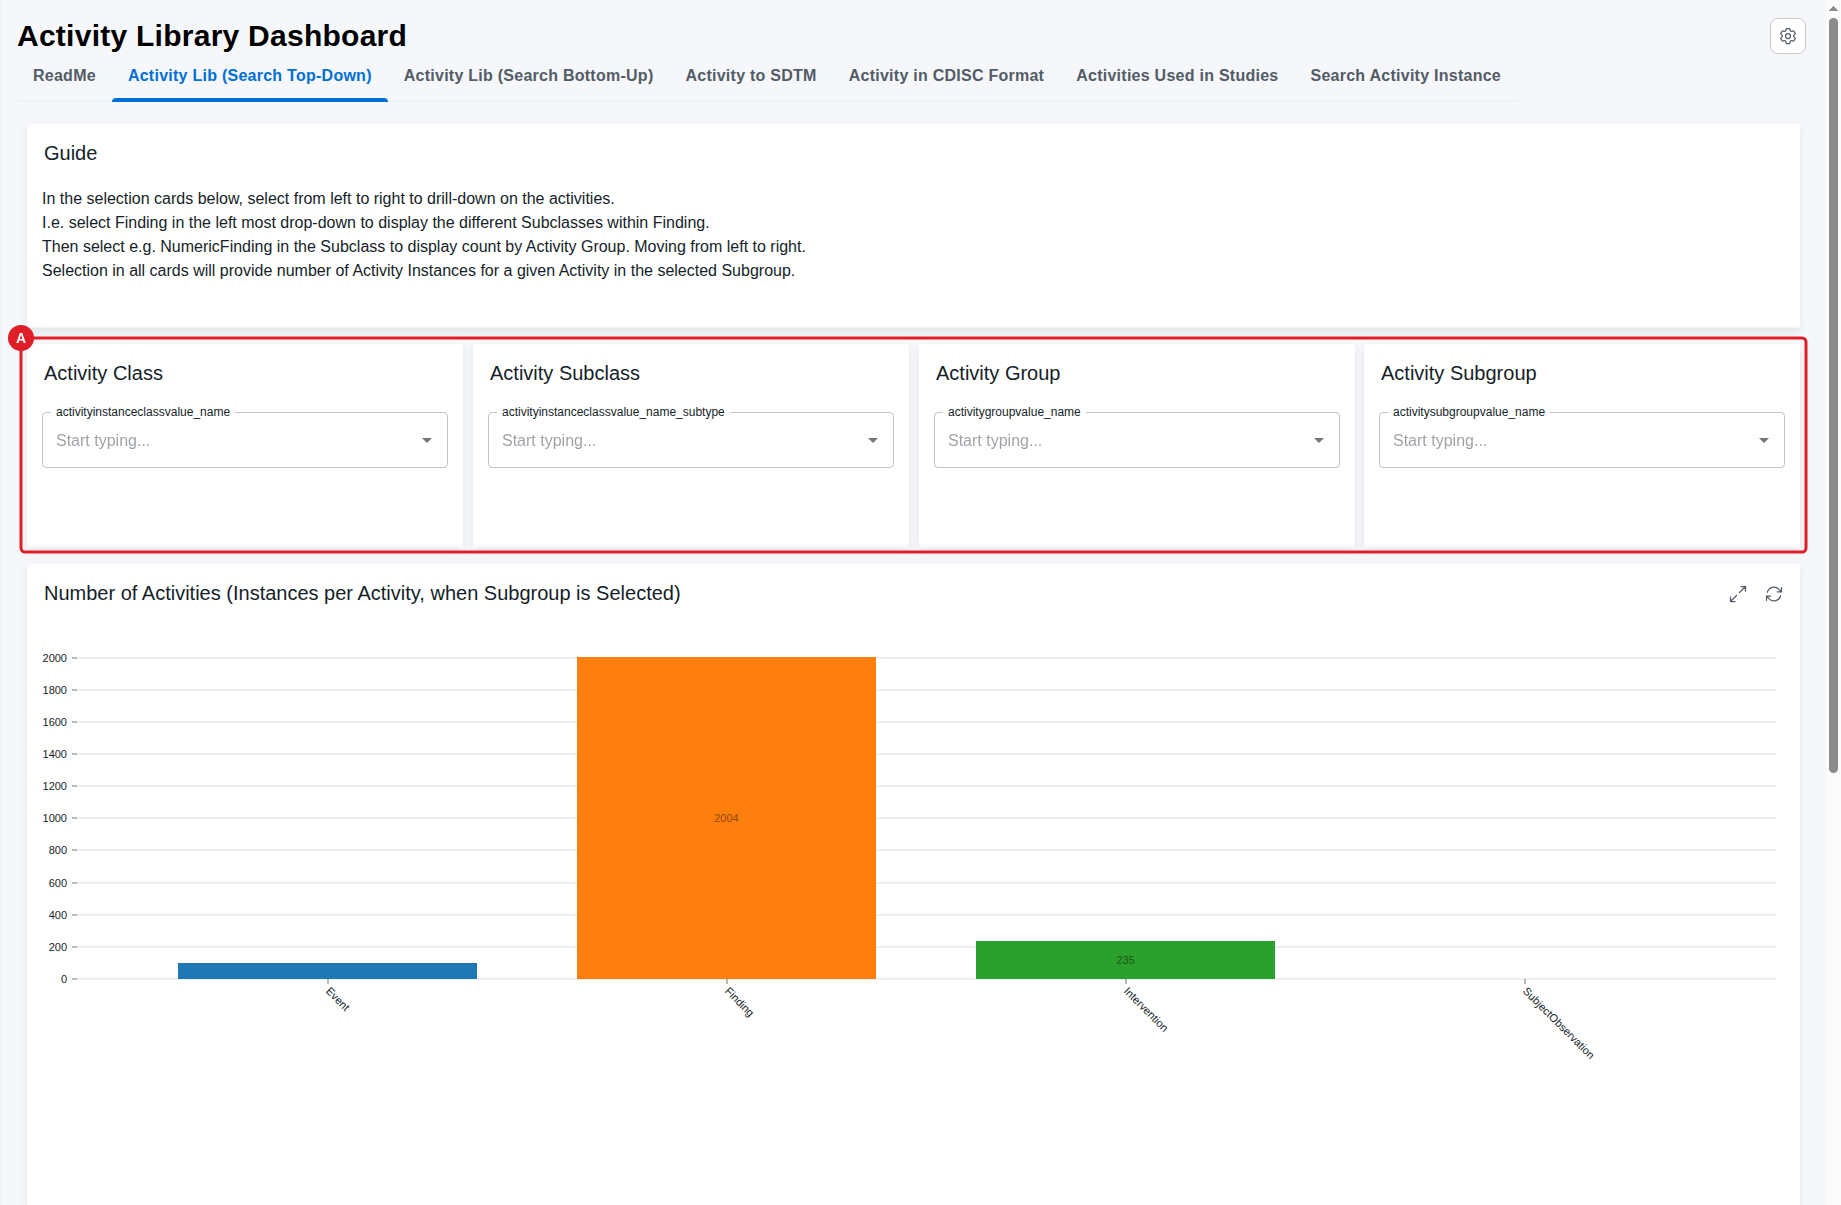
- In the selection area (A) pick class → sub-class → group → sub-group.
The selection area (A) is four cards — Activity Class, Activity Subclass, Activity Group, Activity Subgroup — filtered left to right: start typing in the left-most card and each choice narrows what the cards to its right offer. The Number of Activities histogram below the cards narrows in step with your selection. With nothing chosen yet, all four cards are open and the histogram breaks down all activities by Activity Class:
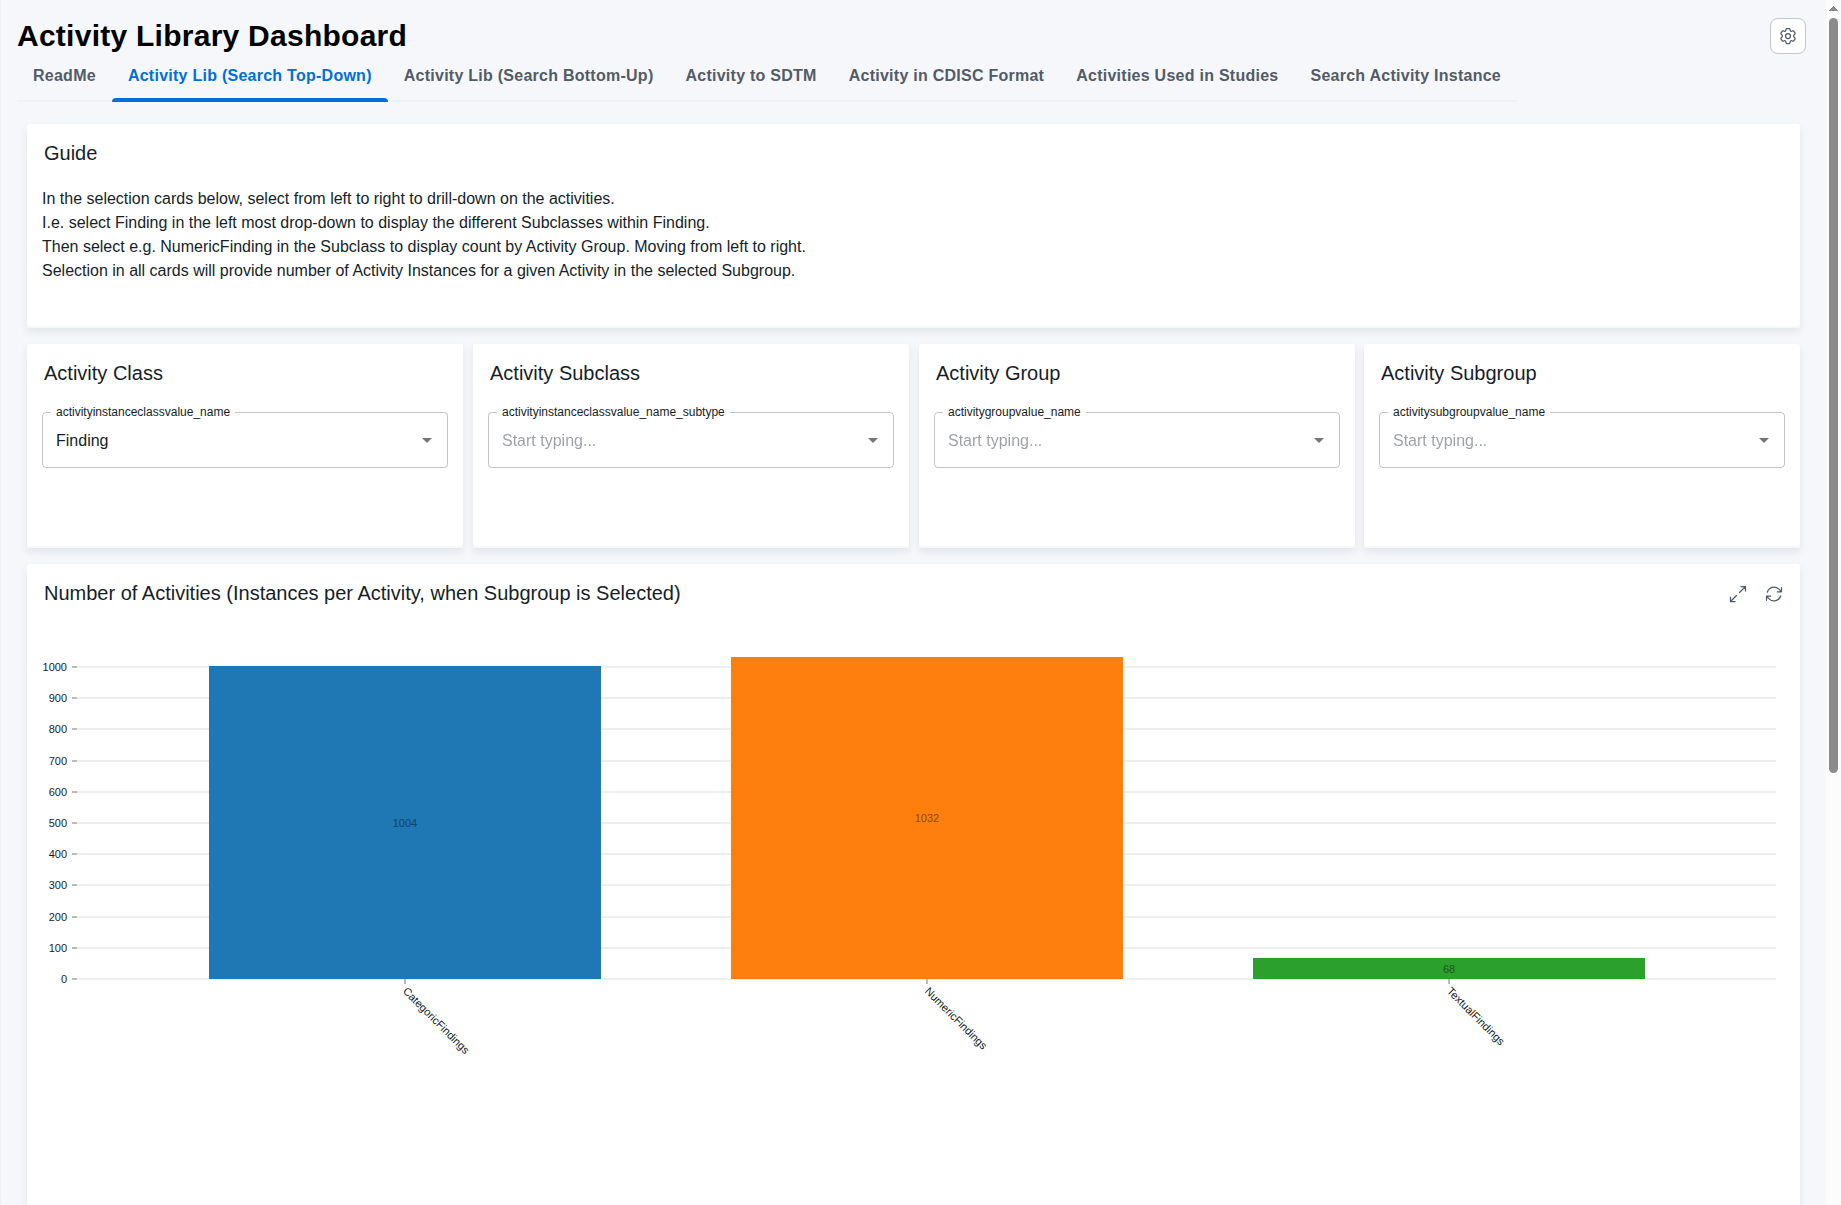
Picking a value in Activity Class — here Finding — narrows the report to that class; the remaining cards and the rest of the dashboard now only offer values consistent with it, and the histogram redraws one level down, by Activity Subclass:
Continue the same way through Subclass, Group and Subgroup until the dashboard resolves to a single activity and its instances:
- Click an activity in the List of activities (C) to see its tabular details (D) and its logical/physical graph view (E).
- In Select Instance (F) click an instance to display its details and logical view (G).
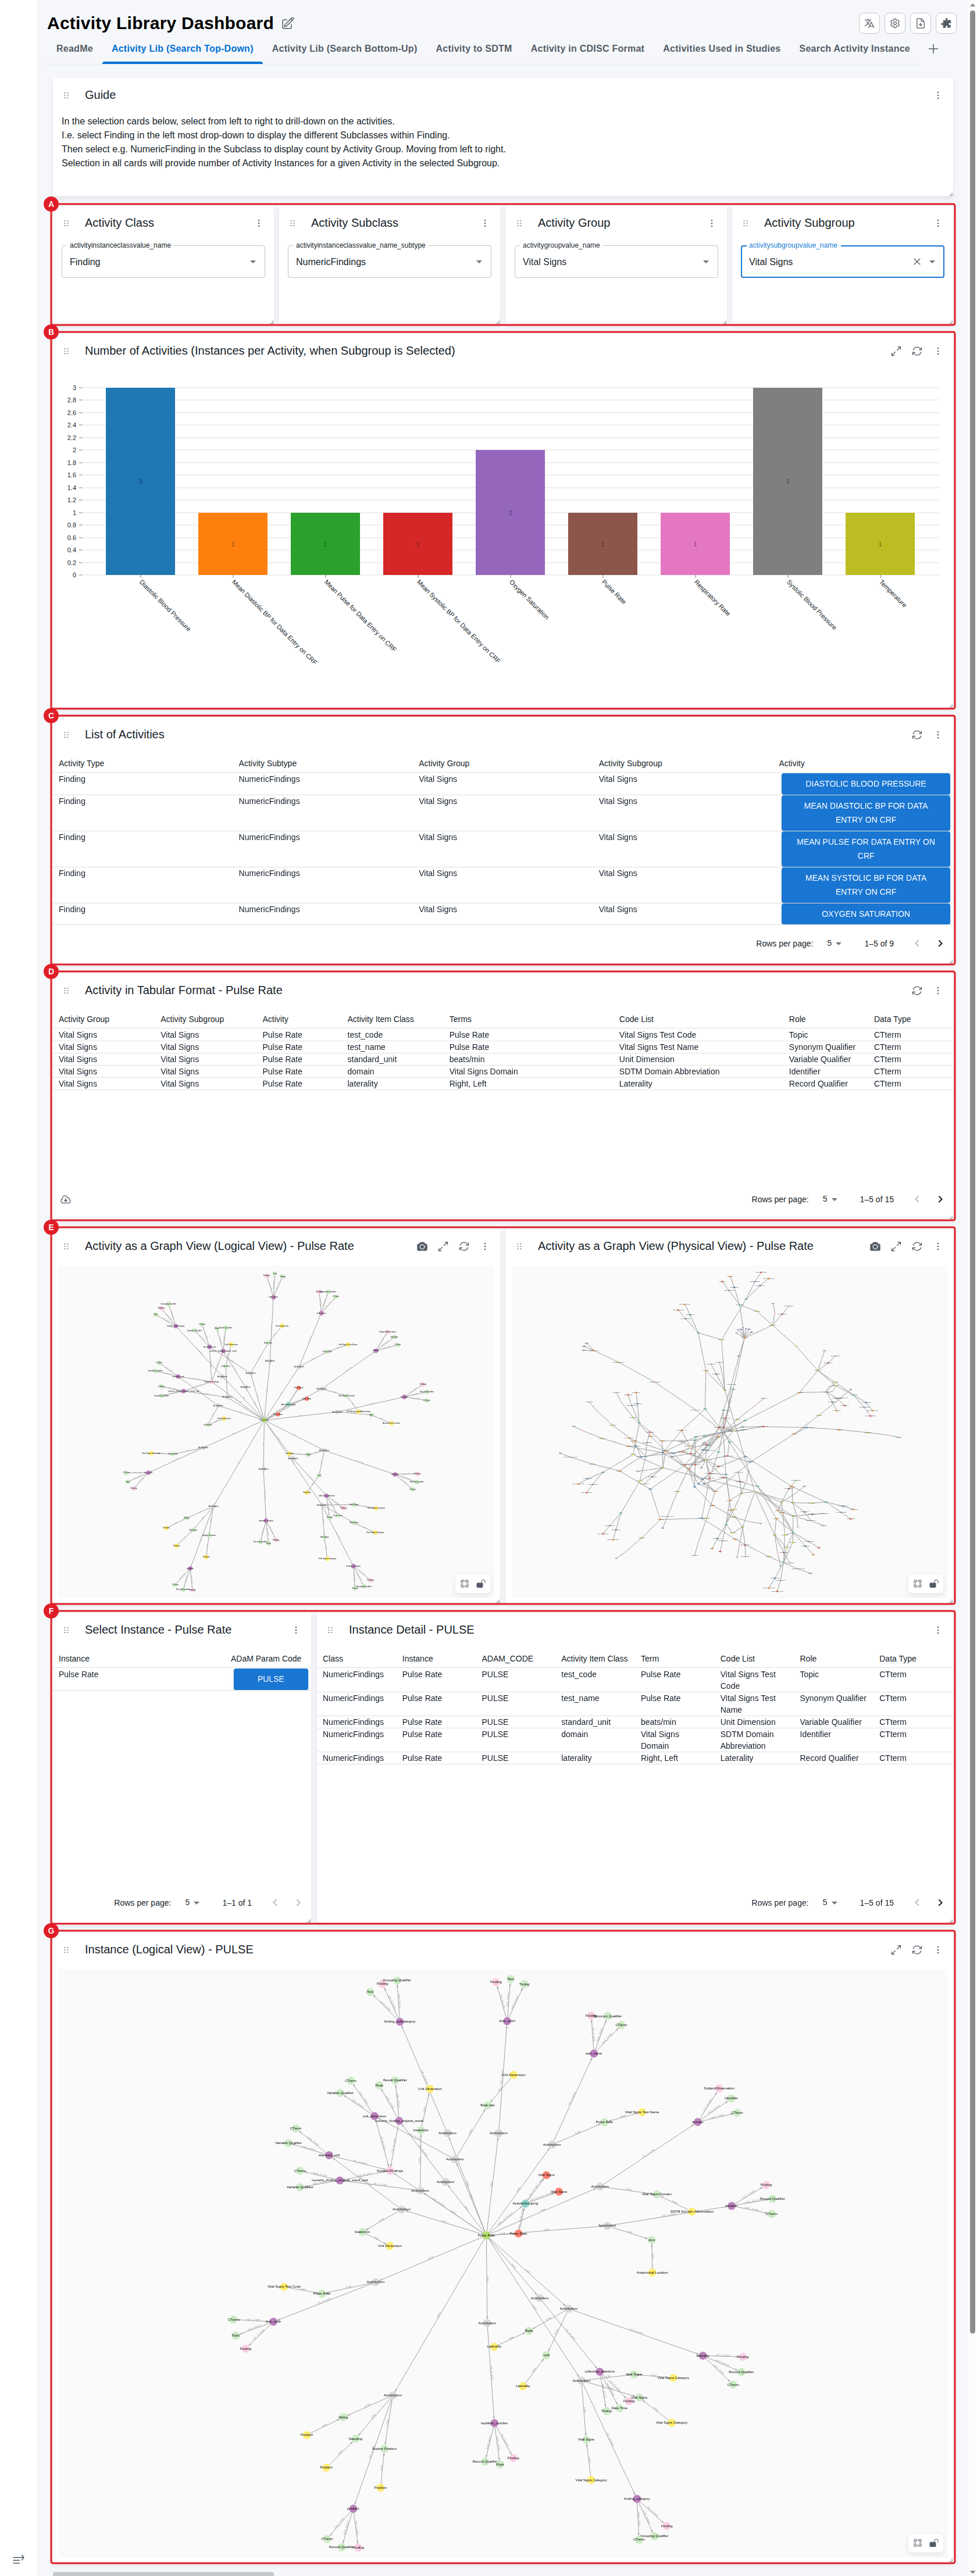
In the worked example the selection area (A) is Finding → NumericFindings → Vital Signs → Vital Signs. The Number of activities histogram (B) updates as you filter; specifying a sub-group displays each activity as an individual bar whose height is its number of instances. The List of activities (C) lists the matching activities — here Pulse Rate is selected, displaying its tabular details (D) and its logical / physical graph view (E). The lower section lets you pick a specific activity instance (F) — PULSE — and shows the instance detail and logical view (G).
Activity Lib (Search Bottom-Up)
Purpose: Starts from one or more activity names and shows which groups and sub-groups they belong to.
When to use: Use it when you know the activity name(s) but not their groupings.
Show Quick Guide
- Type one or more activities in the search field (A).
- Review the groups (B) and sub-groups (C) the activity belongs to.
- In the table (D) click Show Detail for an activity to display its instance details (E).
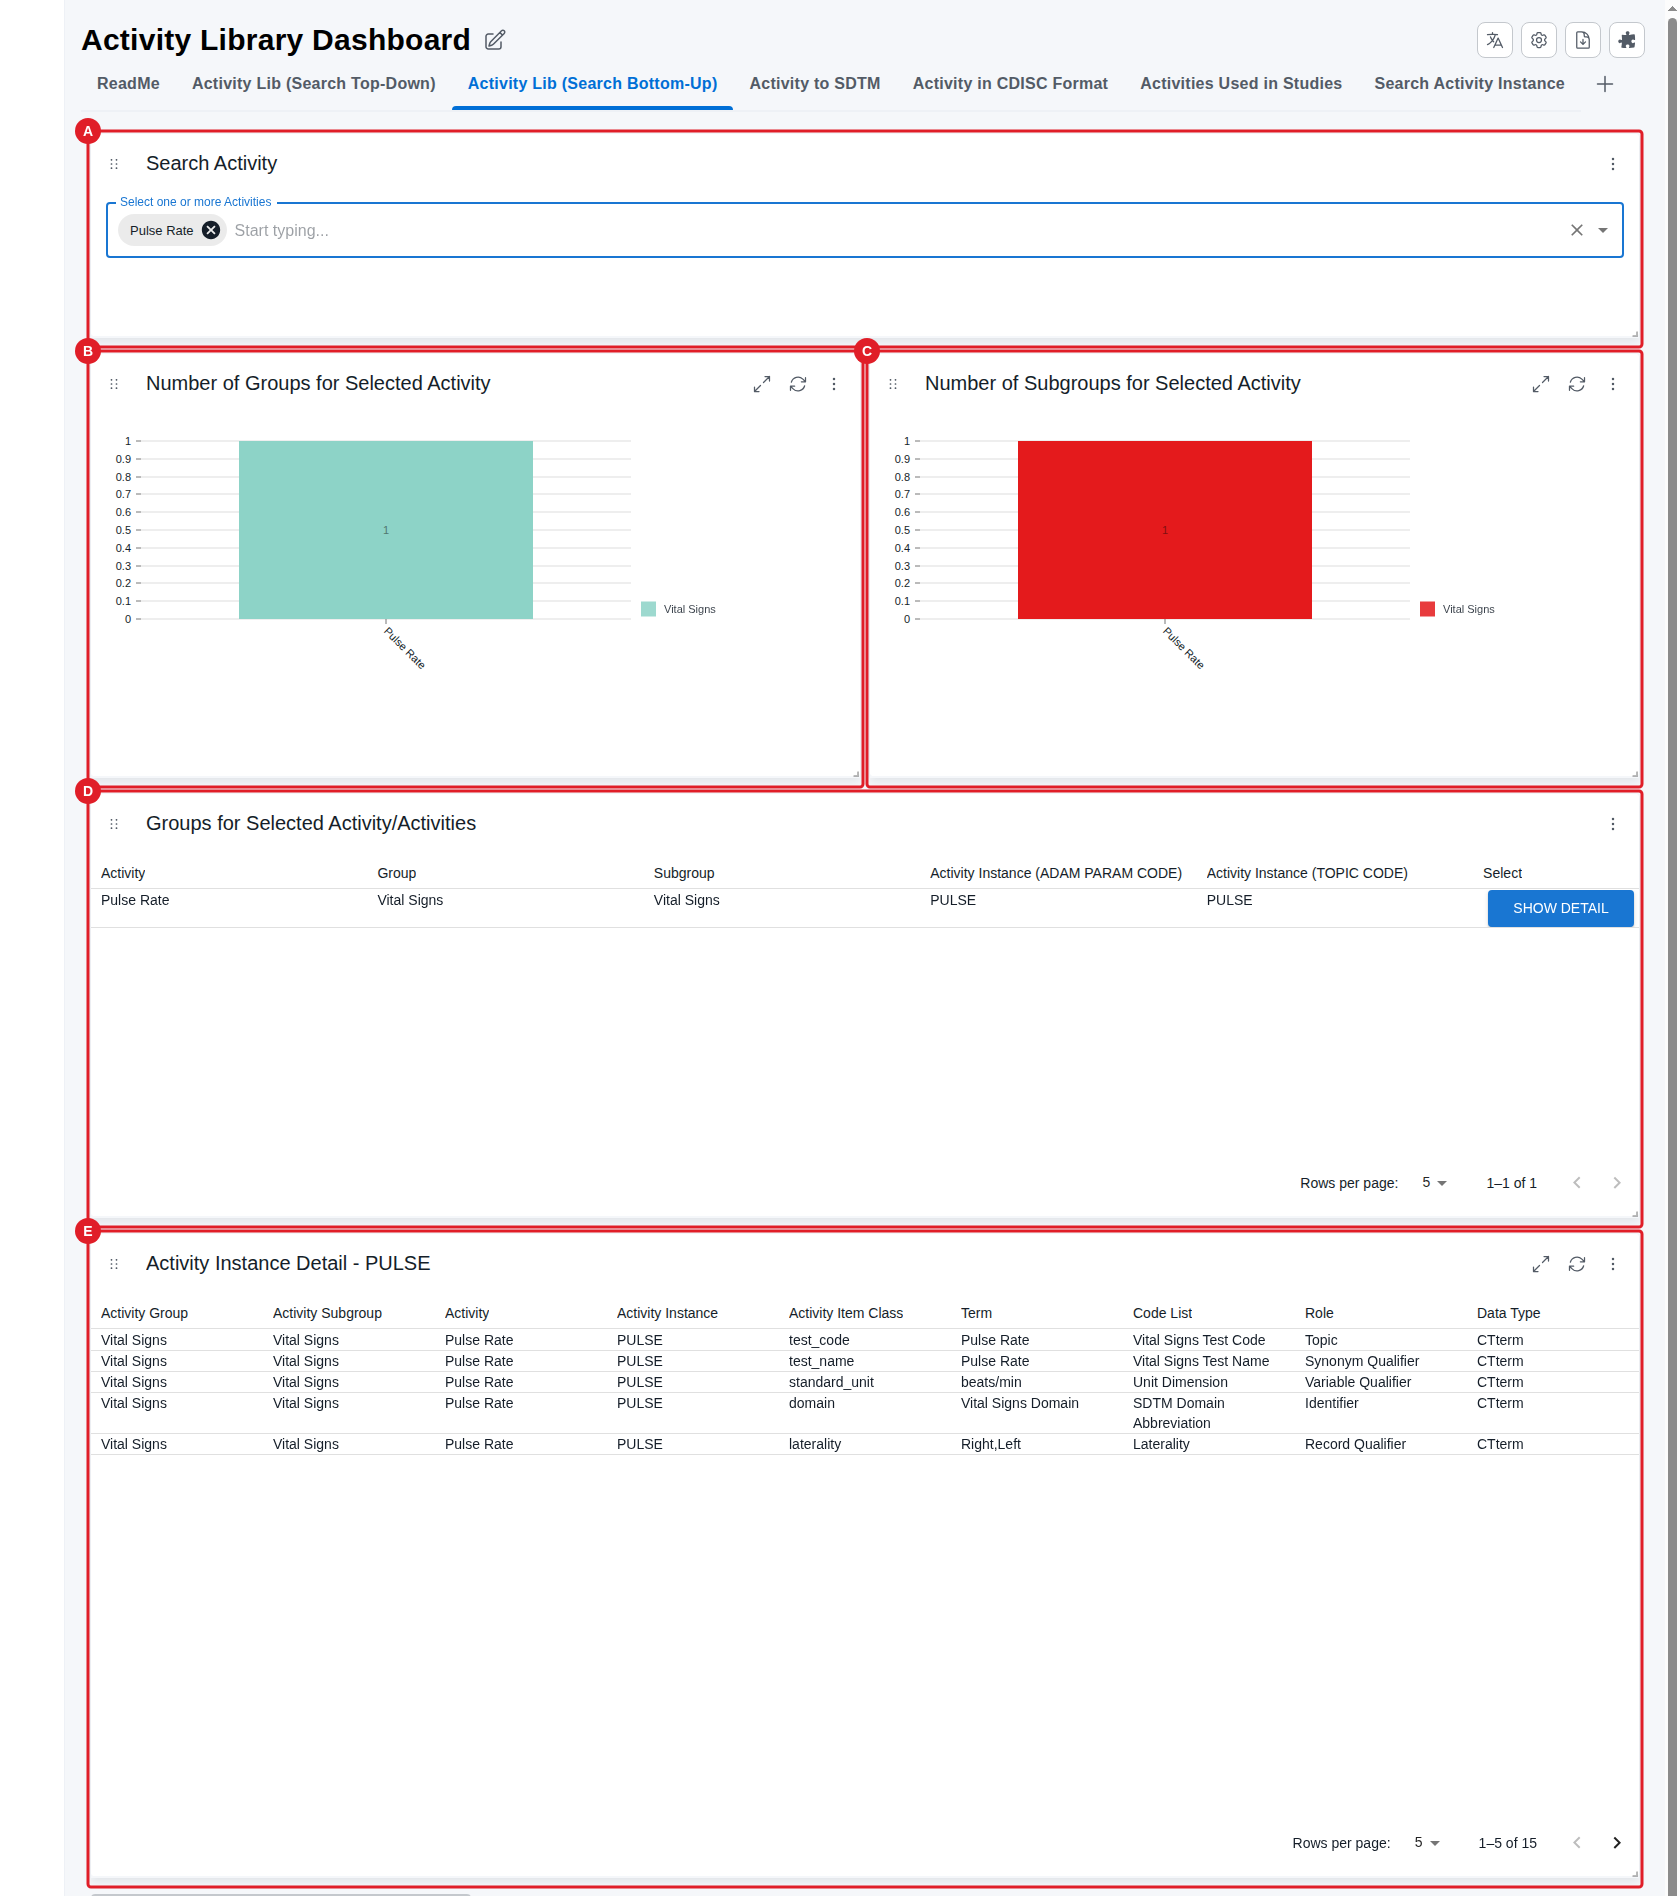
Search for one or more activities in the search field (A) — here Pulse Rate. The dashboard shows the groups (B) and sub-groups (C) it belongs to — both Vital Signs in this example. The table (D) lists the activity with its group, sub-group and instance codes (ADaM PARAM / TOPIC code PULSE); click Show Detail to display the activity instance details (E) - its items, terms, datatype and role.
Activity to SDTM
Purpose: Shows how an activity instance maps to SDTM items for a chosen implementation guide, as both a table and a graph view.
When to use: Use it when you need to check how an activity instance maps to SDTM for a specific implementation-guide version.
Show Quick Guide
- Select an activity sub-group in Limit List of Activities (A) to keep within the 1000-row display limit, then pick an instance in Select Activity Instance.
- Choose an SDTM Implementation Guide (SDTMIG) version (B).
- Read the SDTM mapping (C) either a table-view or the graph-view. The graph-view is displaying the data as they are stored in the database. The table-view is a rendition of a selection of the nodes and selection of node properties. In the graph-view, click or right-click a node to inspect its properties — see Inspect graph node properties.
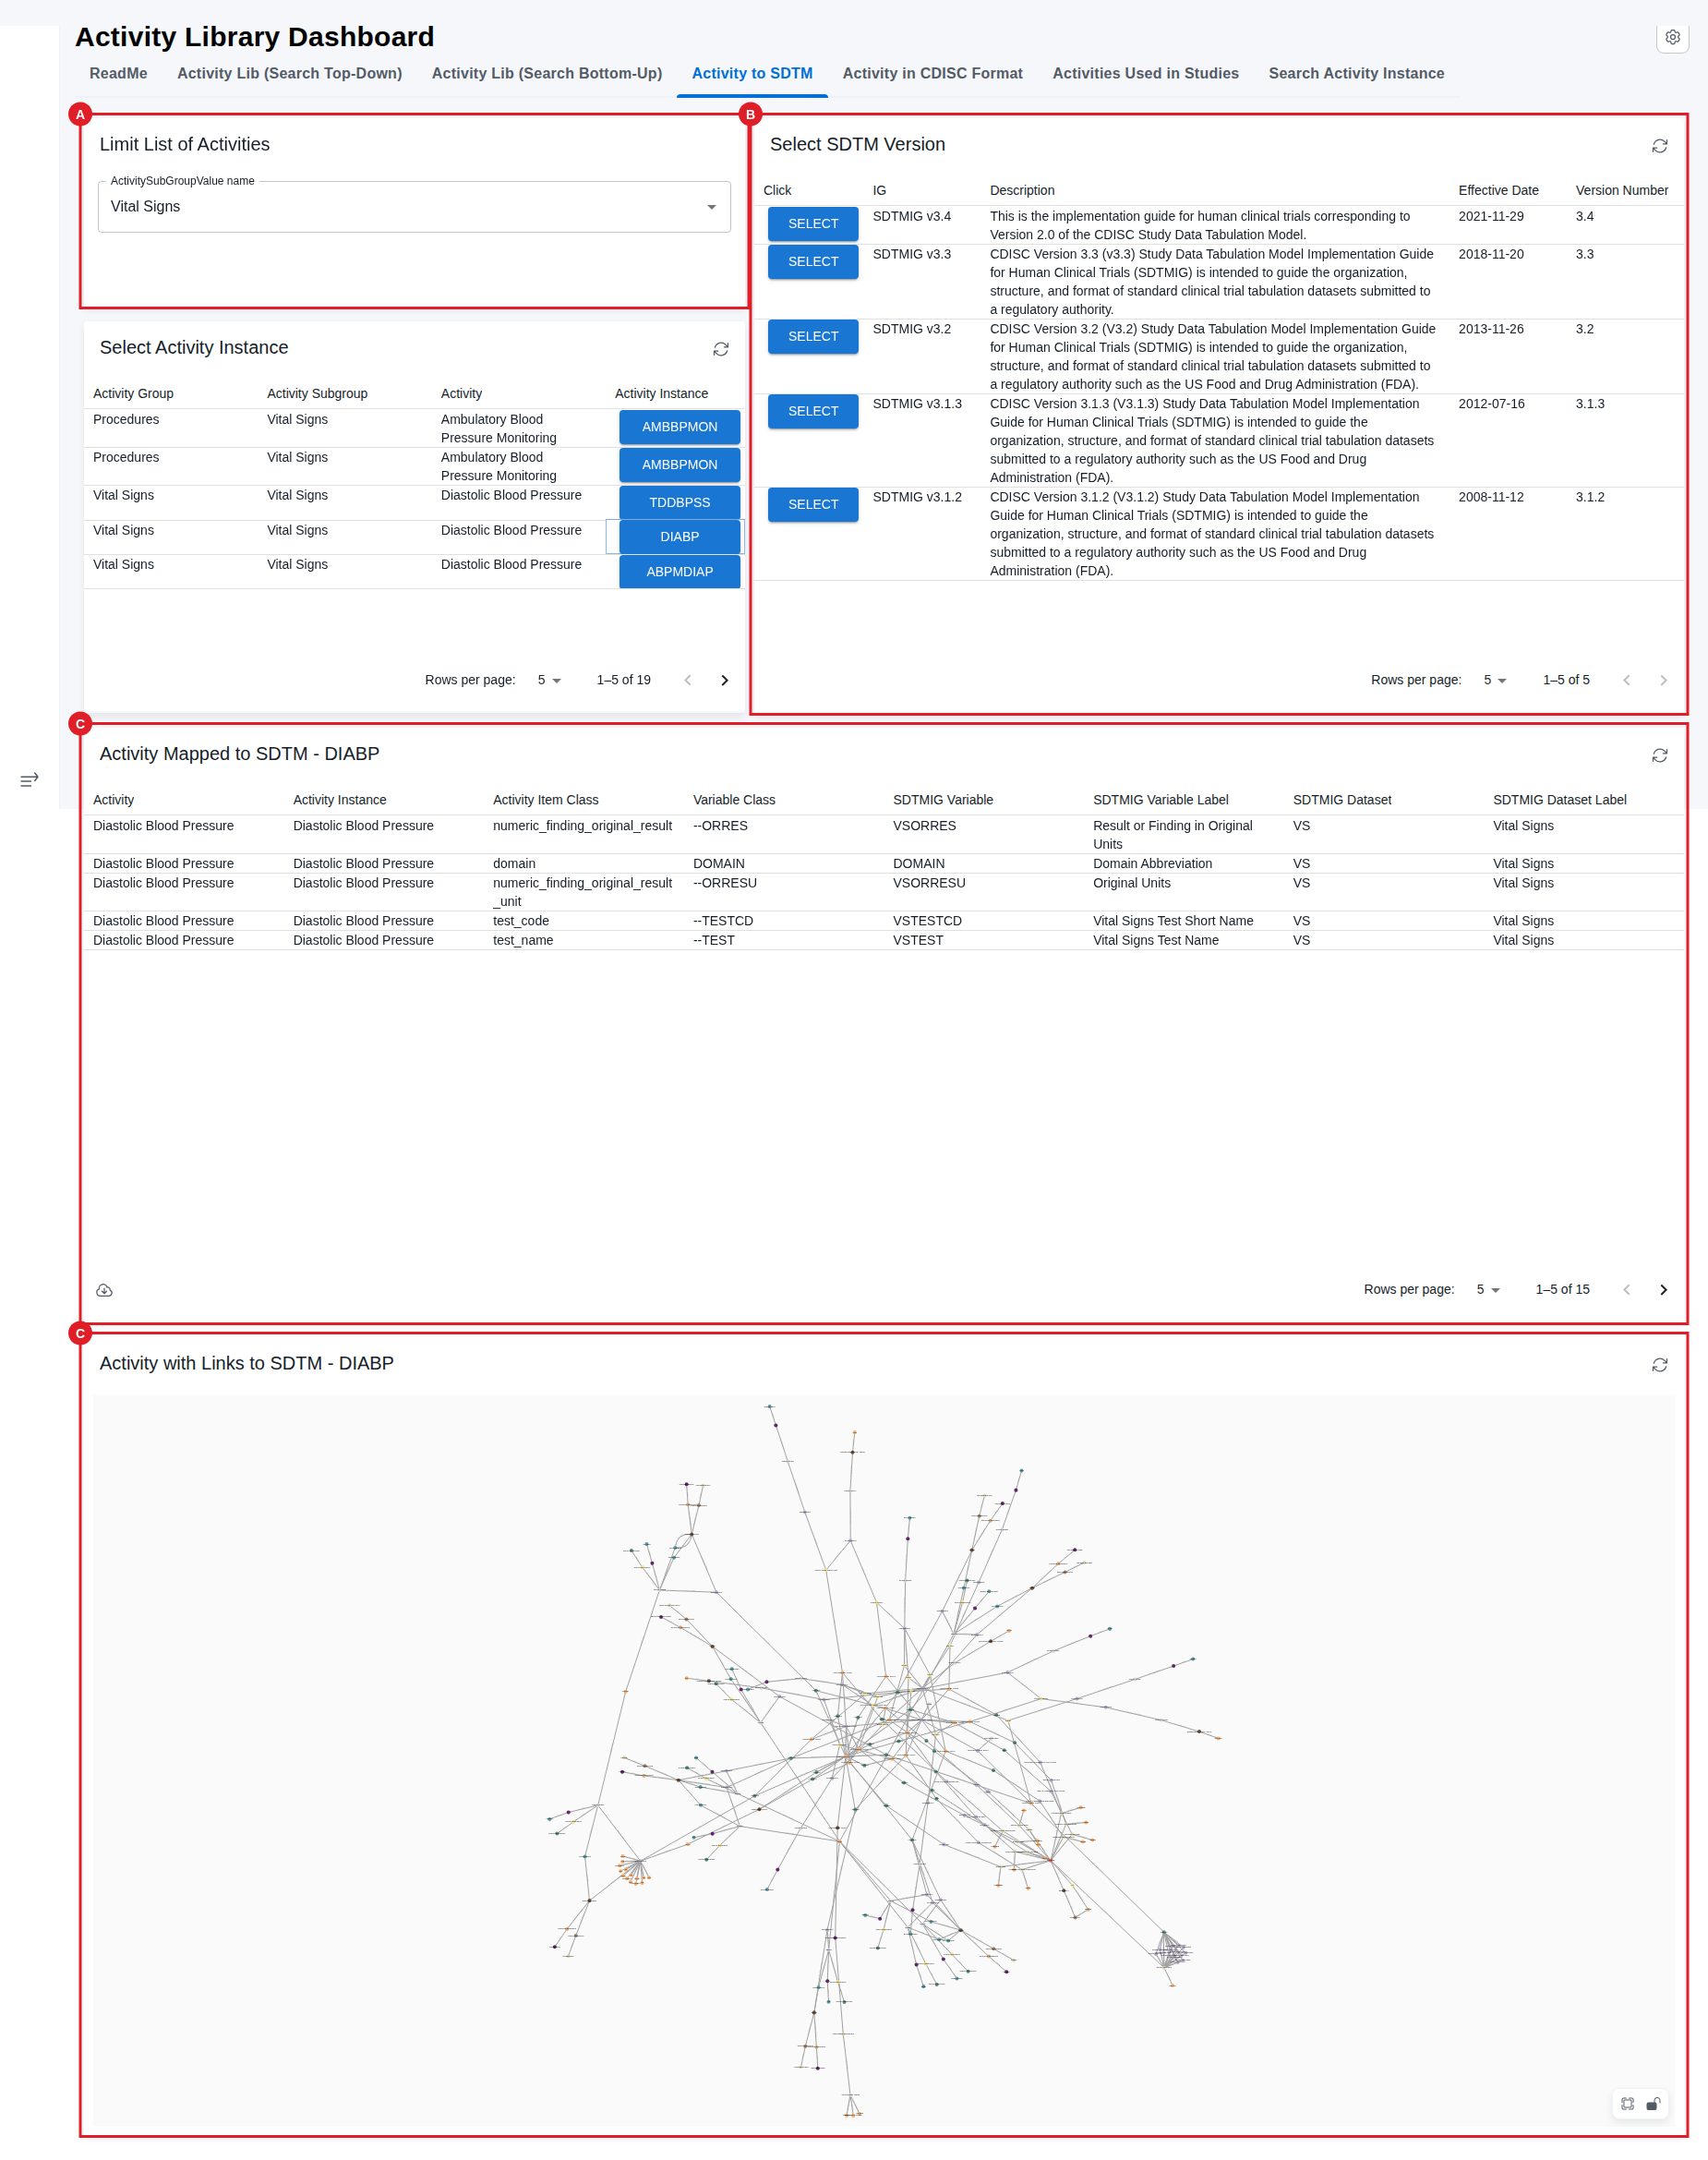
The dashboard has a 1000-row display limit, so narrow with Limit List of Activities (A) — here sub-group Vital Signs — and pick the instance (DIABP). Because SDTM standards evolve, choose a specific implementation version (B) — here SDTMIG v3.4. The mapping defined in that implementation guide is then displayed (C) in two linked cards — the Activity Mapped to SDTM table (e.g. Diastolic Blood Pressure maps to VSORRES in domain VS) and the Activity with Links to SDTM graph view of the same mapping. For some activities the mapping may not yet exist in the database, in which case nothing is shown until it is added.
Activity in CDISC Format
Purpose: Renders an activity as a CDISC BC Concept and SDTM Dataset Specialization, each as YAML and as a CDISC-Excel-style table.
When to use: Use it when you need a biomedical concept and its SDTM dataset specialization exported in CDISC's own formats for interoperability.
Show Quick Guide
- Read the Info card (A) for an overview of the tab.
- Optionally narrow with Limit List (Search Activity Subgroup) (B), then pick an activity in Select Activity (C); the choice is echoed in Selected Activity (D).
- The activity renders as a CDISC BC Concept in Activity as CDISC BC Concept (E, YAML) and BC tabular view (F, table).
- Pick a CDISC SDTM Version (G) and an activity Instance (I) to render the SDTM dataset specialization in Activity as CDISC SDTM Dataset Specialization (H, YAML) and SDTM Specialization tabular view (J, table); allow a moment for the NCI terminology API.
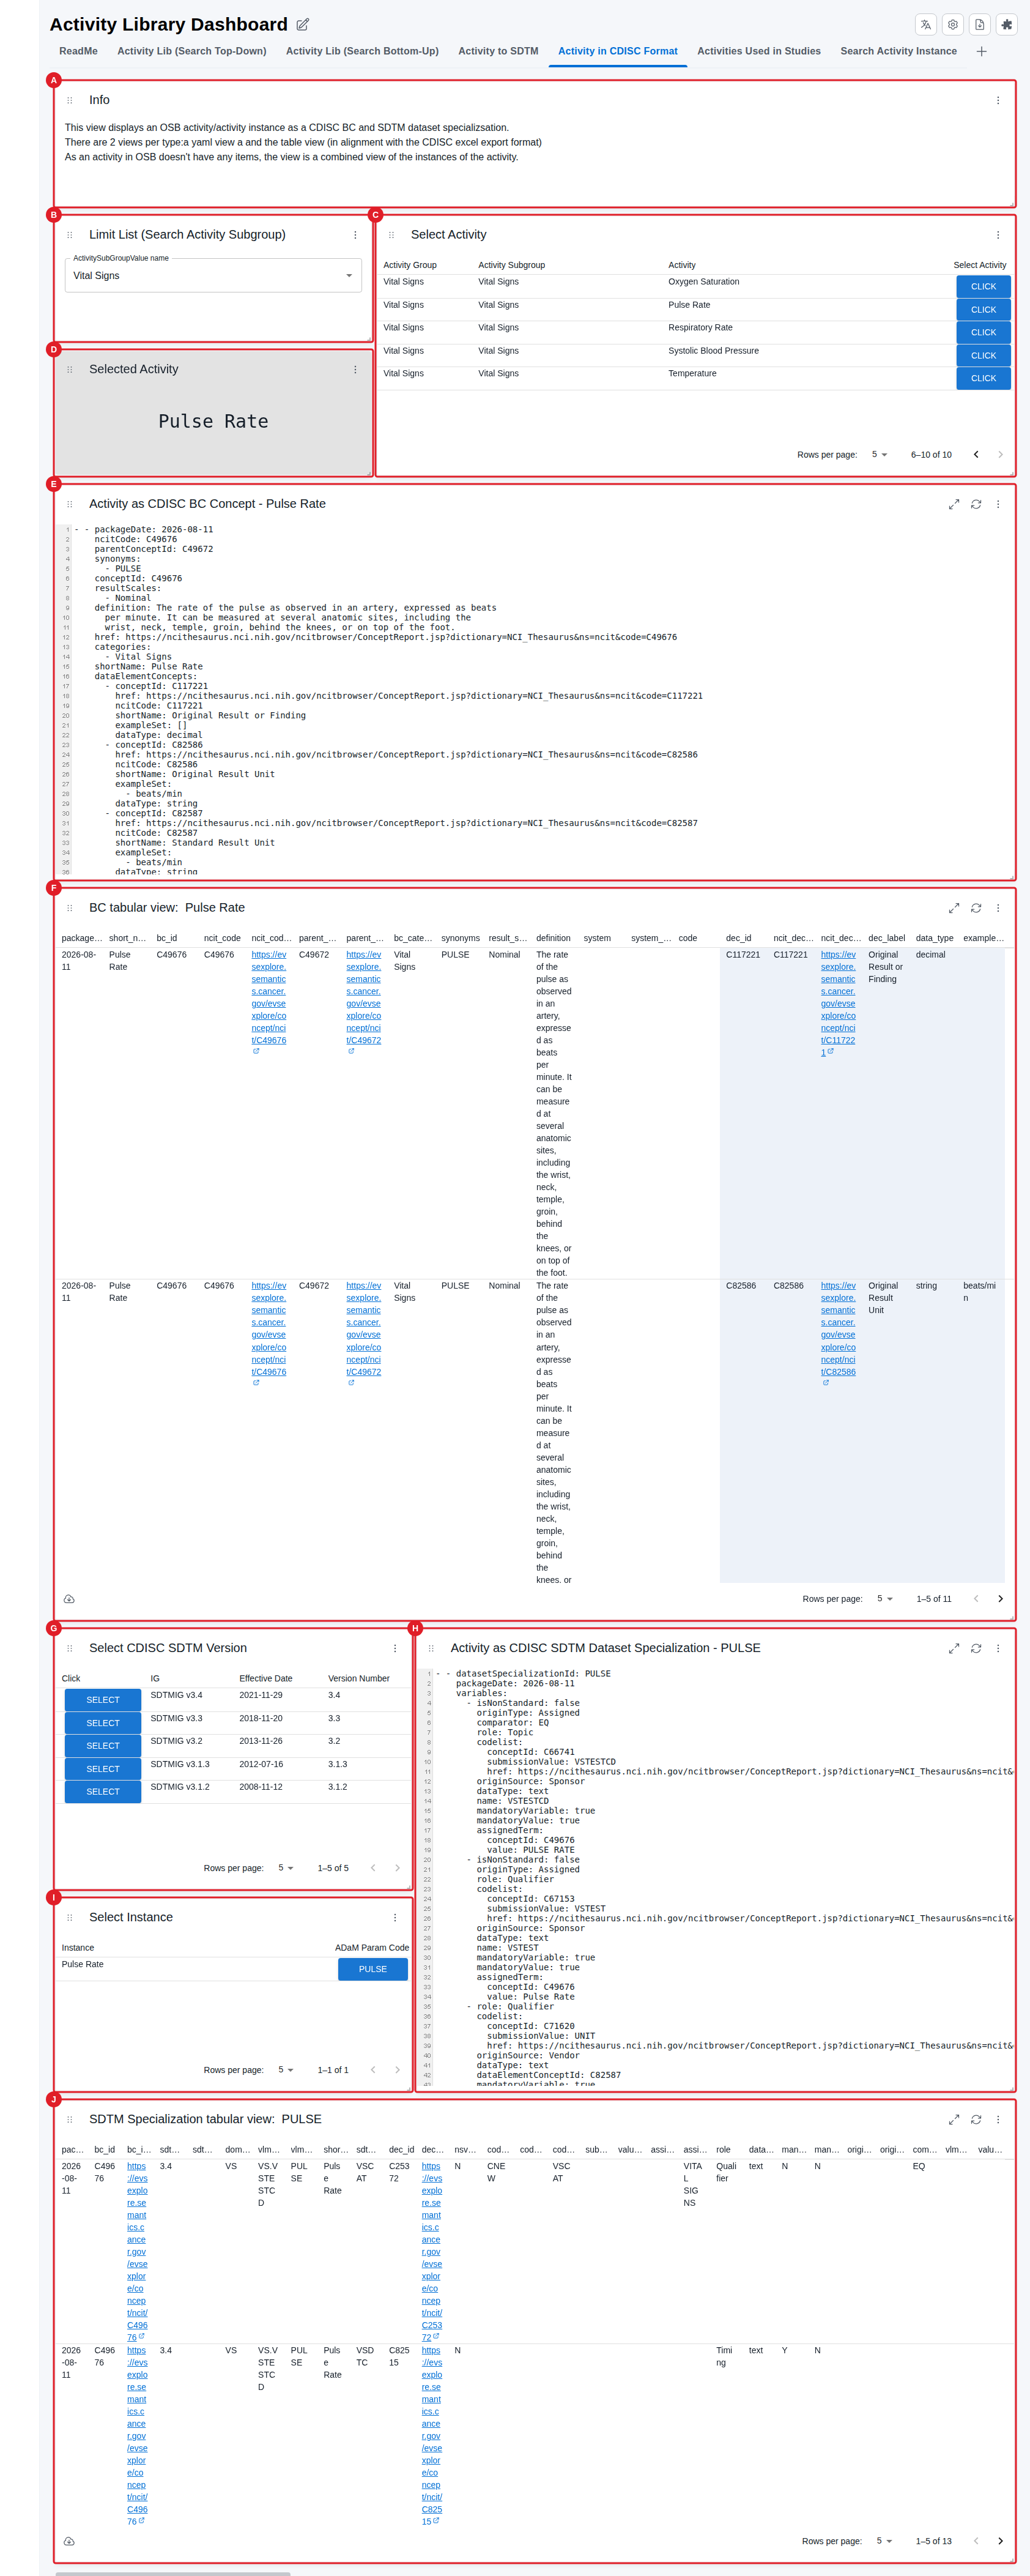
The dashboard maps the activities defined in OpenStudyBuilder into CDISC's own formats — a BC (Biomedical Concept) and an SDTM Dataset Specialization — each available two ways: a YAML view, and a table view that mirrors the columns of CDISC's Excel-based BC and SDTM Dataset Specialization export files. Because an OpenStudyBuilder activity has no items of its own, the table views are a combined view across the activity's instances.
Select the activity (C) — here Pulse Rate — which is echoed in Selected Activity (D). The activity renders as a CDISC BC Concept (E, YAML — e.g. conceptId: C49676, domain: VS) and, in the same layout as the CDISC BC Excel export, as a BC tabular view (F, e.g. columns bc_id, ncit_code, data_type). Choose a CDISC SDTM Version (G) — here SDTMIG v3.4 — and an Instance (I) — here PULSE — to render the CDISC SDTM Dataset Specialization (H, YAML — datasetSpecializationId: PULSE, variables VSTESTCD, VSORRES, …) and, in the same layout as the CDISC SDTM Dataset Specialization Excel export, the SDTM Specialization tabular view (J, e.g. columns sdtm_variable, role, codelist).
The following shows an example of how the activity instance "TEMPERATURE" is represented in the CDISC BC YAML format.
yaml
category:
  - Vital Signs
dataElementConcepts:
  - dataType: string
    conceptId: C44276
    exampleSet:
      - TEMPERATURE
    shortName: unit_dimension
    href: https://ncithesaurus.nci.nih.gov/ncitbrowser/ConceptReport.jsp?dictionary=NCI_Thesaurus&ns=ncit&code=C44276
  - dataType: string
    conceptId: C82587
    exampleSet:
      - C
    shortName: standard_unit
    href: https://ncithesaurus.nci.nih.gov/ncitbrowser/ConceptReport.jsp?dictionary=NCI_Thesaurus&ns=ncit&code=C82587
  - dataType: string
    conceptId: C25341
    exampleSet:
      - SKIN
    shortName: location
    href: https://ncithesaurus.nci.nih.gov/ncitbrowser/ConceptReport.jsp?dictionary=NCI_Thesaurus&ns=ncit&code=C25341
packageType: bc
definition: A measurement of the temperature of the body.
synonym:
  - TEMP
  - Temperature
resultScale:
  - Quantitative
conceptId: C174446
domain: VS
parentConceptId: C25206
shortName: Body Temperature
href: https://ncithesaurus.nci.nih.gov/ncitbrowser/ConceptReport.jsp?dictionary=NCI_Thesaurus&ns=ncit&code=C174446
packageDate: 2023-04-30
NOTE
As the report is accessing NCI terminology via API it may run for a bit before the yaml structure or tabular view is displayed.
Activities Used in Studies
Purpose: Lists which studies use selected activities, broken down by visit, and shows each study's details.
When to use: Use it when you need to find which studies use a given activity (or set of activities) and review their study-level details.
IMPORTANT
Prerequisites: the SoA (Activity Instances) card only shows data for activities that are scheduled (ticked) at a visit in the study's SoA. This is silent — no error is shown, the card just displays Query returned no data — so if a study you expect to see is missing, check the activity is scheduled at a visit for that study first.
Show Quick Guide
- Choose one or more activities (A); set the AND/OR operator (C) and latest-version Y/N (D).
- Click a Trial ID in the studies list (B).
- Review the study details (E–H).
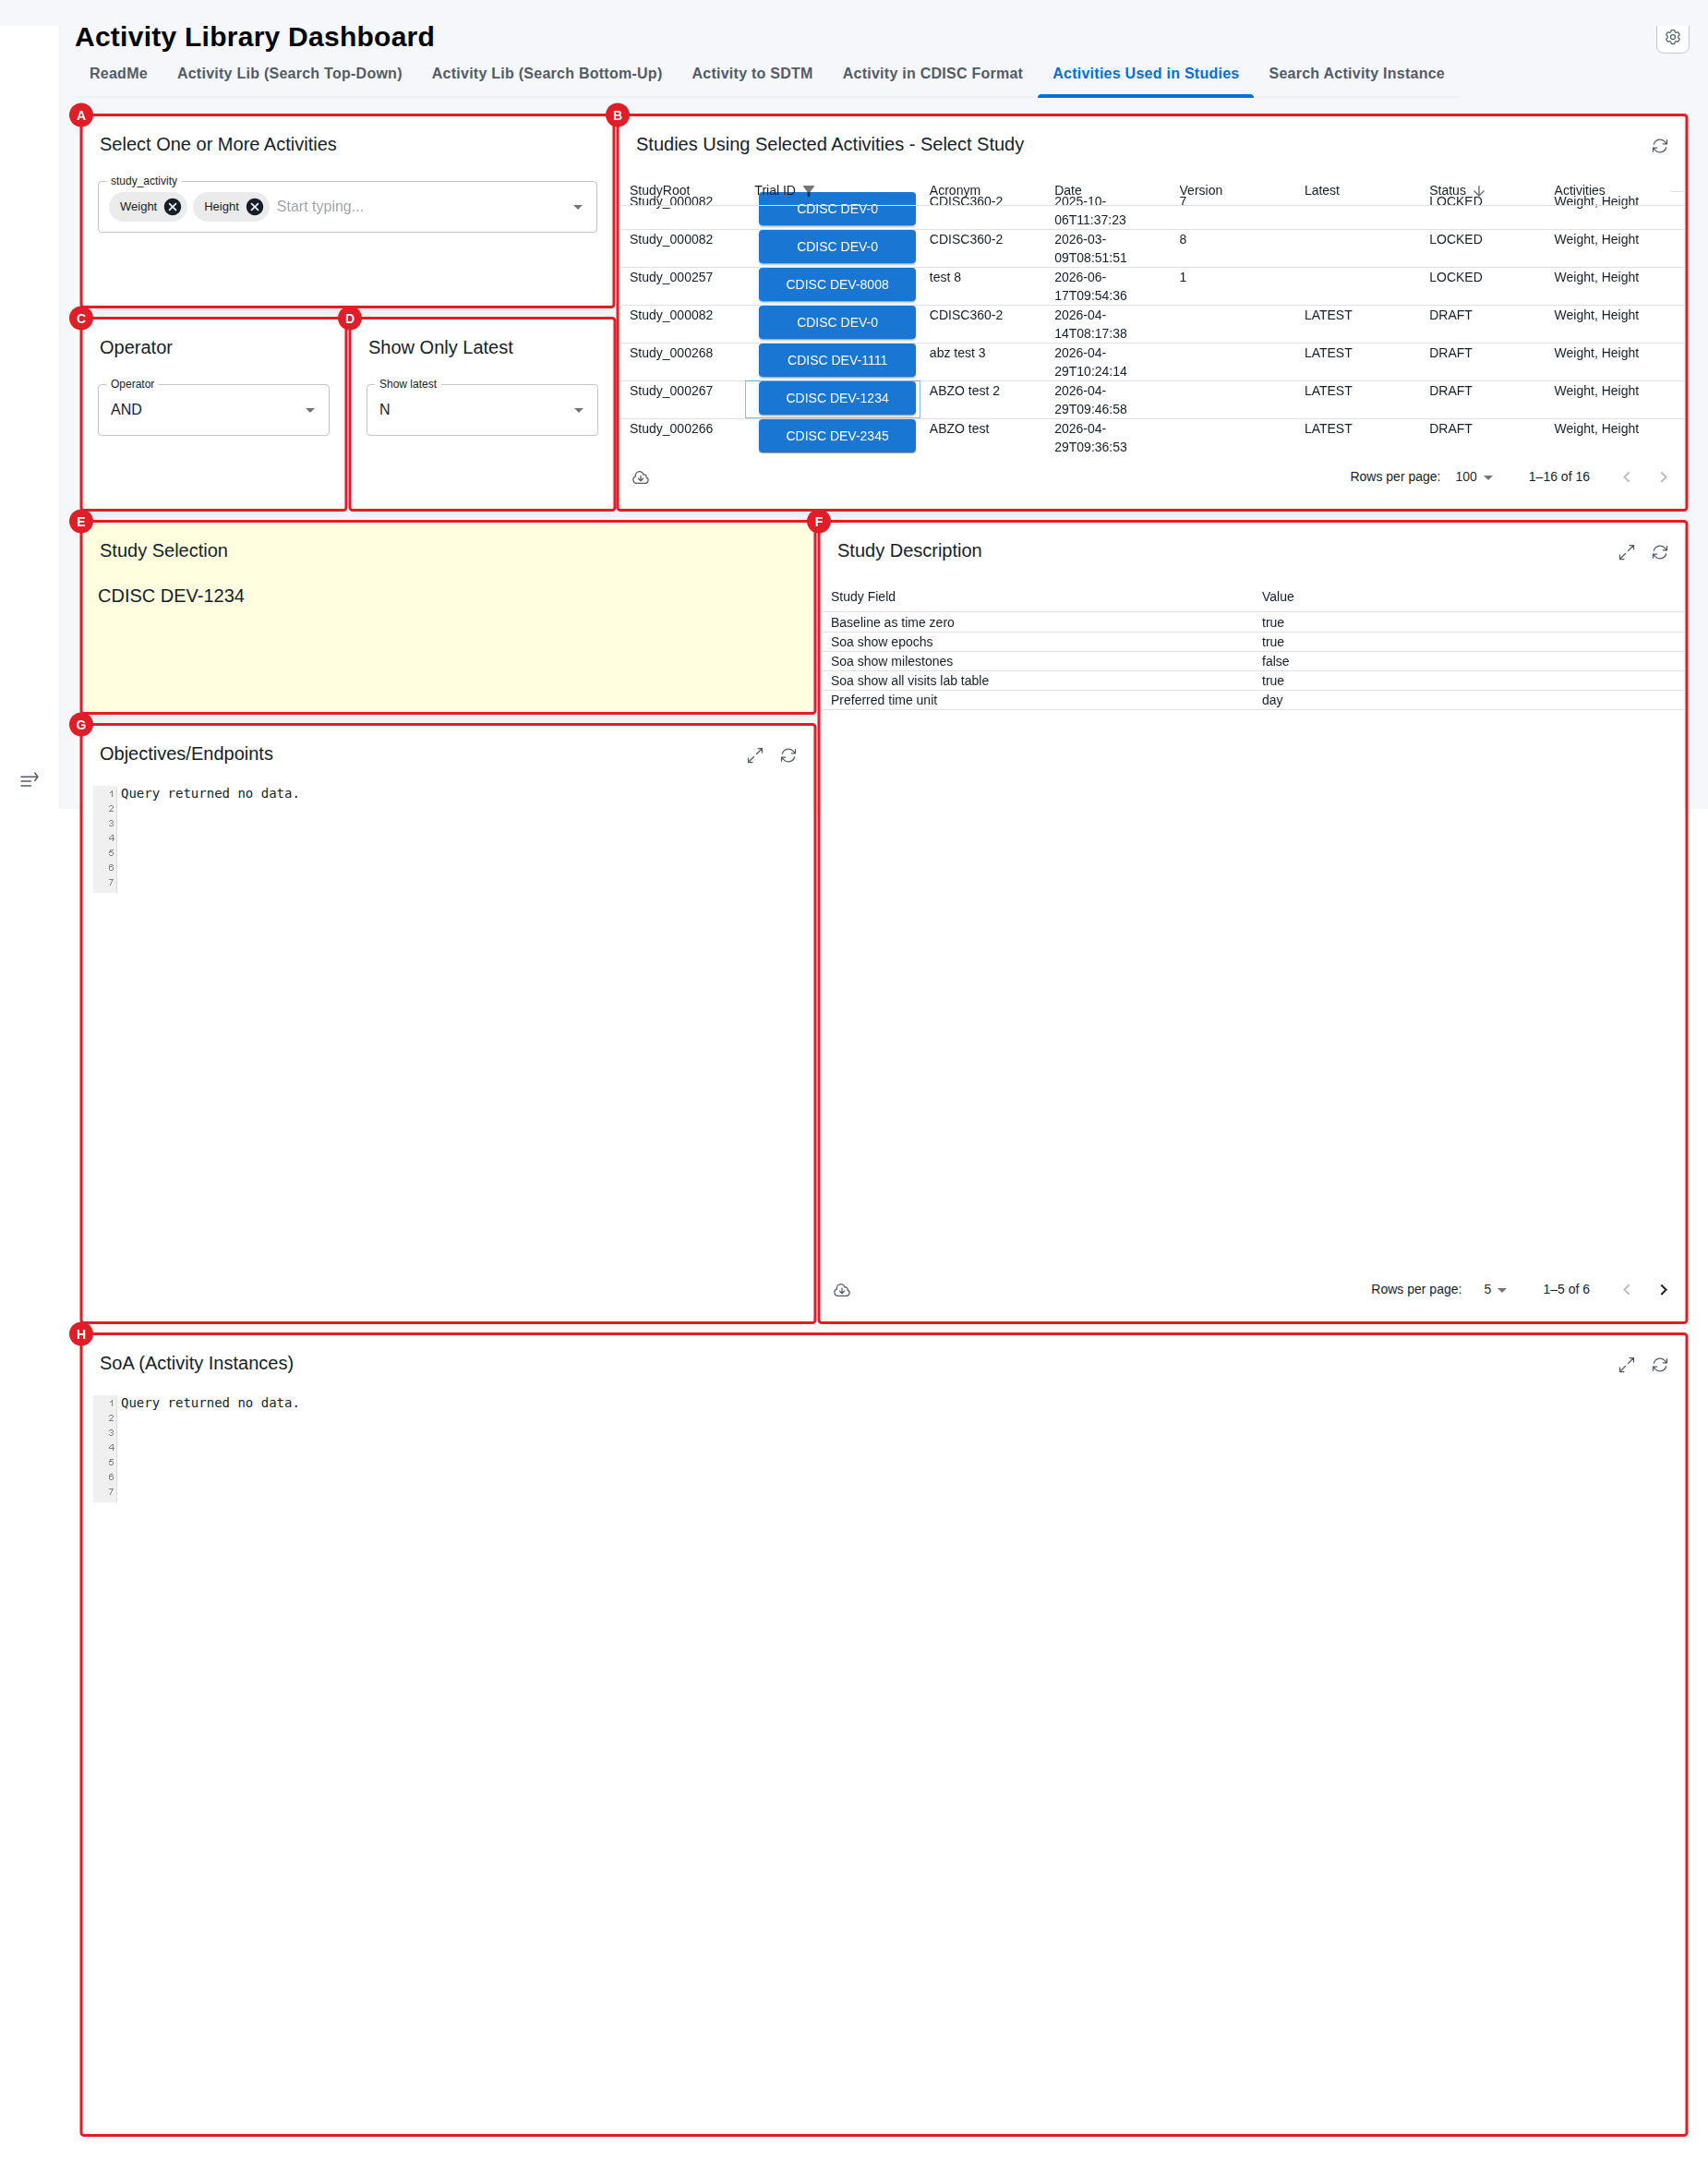
In the selection box (A) choose one or more activities — here Weight and Height. The dashboard lists the studies that use them (B); the Operator (C) only matters when more than one activity is selected — AND (the default) lists only studies using every selected activity, while OR lists any study using at least one of them. Show Only Latest (D) limits the list to the latest study version (Y) or all versions (N). Click a study's Trial ID in (B) — here CDISC DEV-1234 — to display the study details: the selected study (E), overall study descriptions (F), the study objectives and endpoints (G), and the SoA (Activity Instances) card (H) — a matrix of visits against the Activity Instance topic codes showing at which visits the selected activities are collected. In this example study, Weight/Height are not scheduled at a visit in the SoA, so both (G) and (H) show Query returned no data — the silent gap described in the Prerequisites note above, not a defect.
NOTE
See Prerequisites above if card (H) shows Query returned no data.
Search Activity Instance
Purpose: Lets you search and display activity instance details directly, at the ActivityInstance level.
When to use: Use it when you want to look up one or more activity instances directly, without first selecting an activity.
Show Quick Guide
- Search for one or more activity instances directly in the selection box (A).
- Review the displayed instance details (B).
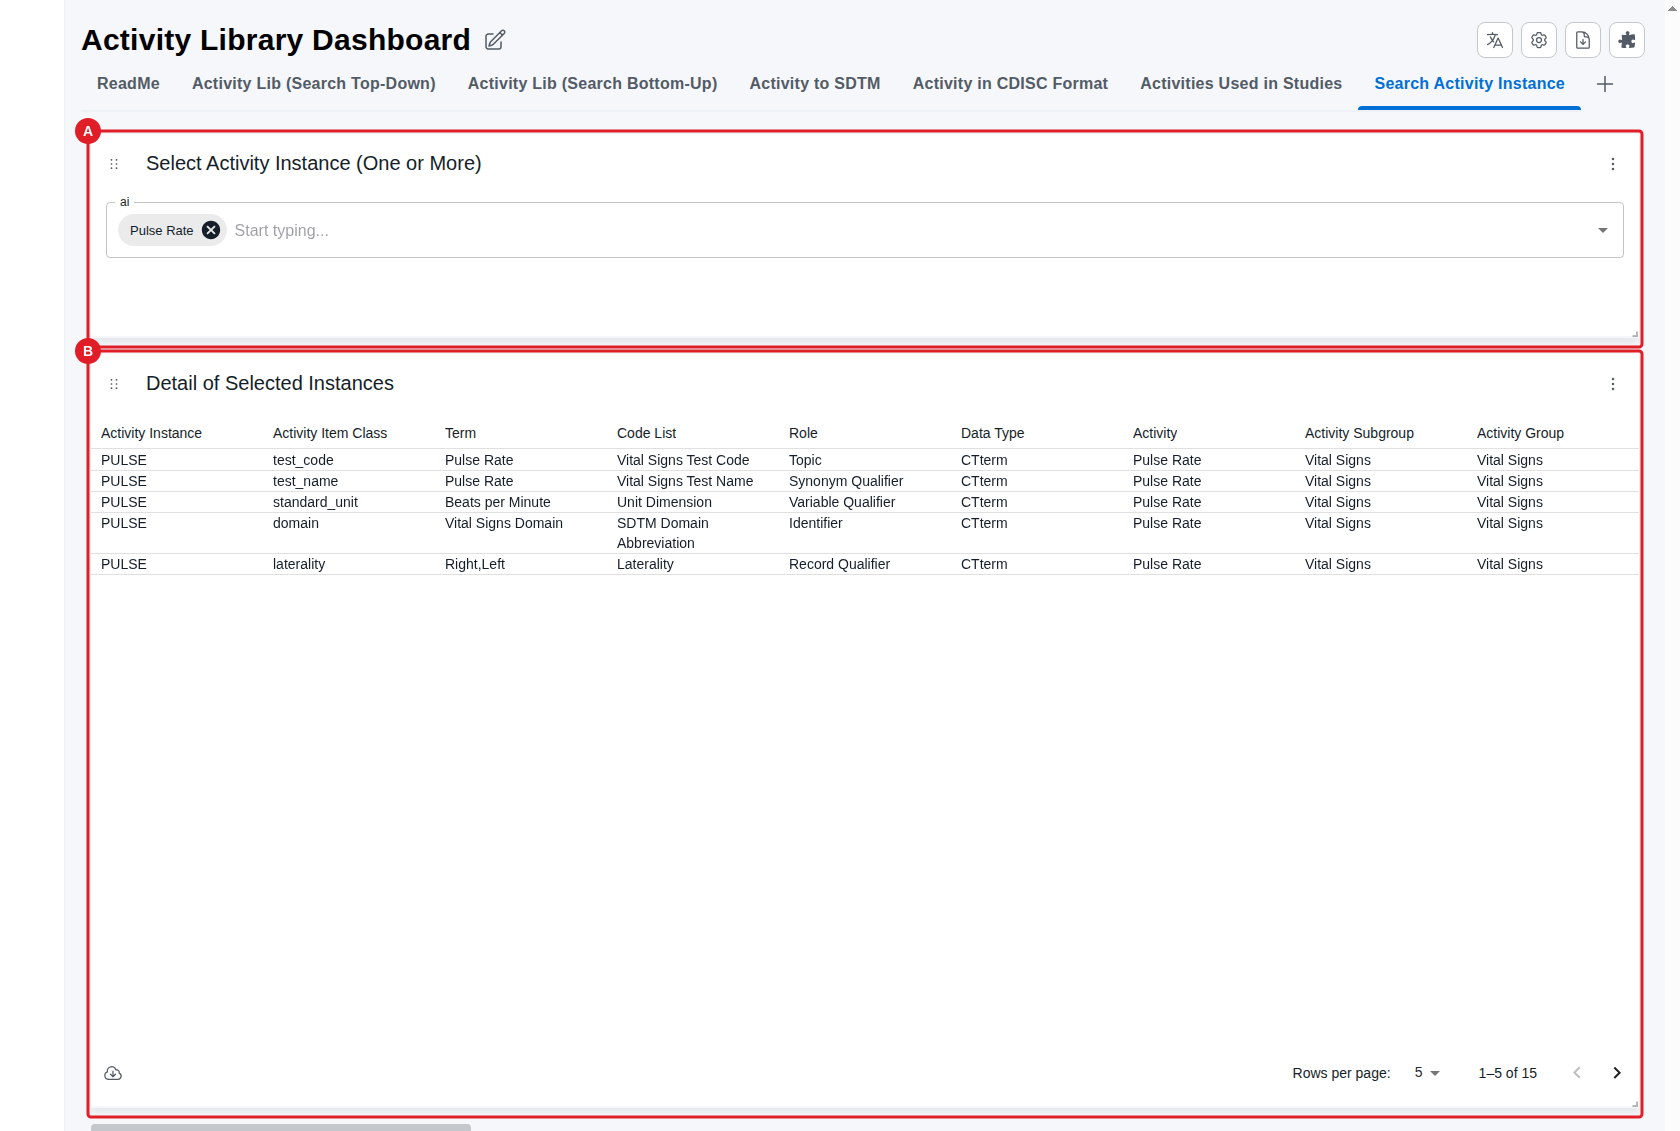
This view provides a quick way to display details of one or more activity instances without having to specify the activity first. Search in (A) — here Pulse — and the matching instance details appear in (B): the activity (Pulse Rate), group and sub-group (Vital Signs), the ADaM topic code (PULSE) and each activity item with its class, role and data type.
Show Solution Architecture
The dashboard reads the graph database directly, exposing logical and physical views of activities and instances. The Activity to SDTM tab has a 1000-row display limit — narrow by sub-group to stay within it. The Activity in CDISC Format tab queries NCI terminology via API, so it may run for a moment before the YAML or tabular views render. Some activity→SDTM mappings may not yet exist in the database and will not display until added.
Common errors
| Symptom | Interpretation | Likely cause | Fix |
|---|---|---|---|
| Activity to SDTM shows nothing / is truncated | Could be either a display limit or a real data gap | 1000-row display limit, or mapping not yet in the database | Select an activity sub-group to narrow the list; if still empty the mapping may not exist yet |
| CDISC BC/SDTM YAML or table takes a long time to appear | Expected — the tab has not frozen | The tab calls the NCI terminology API live | Wait for the API call to complete |
| An expected SDTM mapping is missing | Expected — coverage is incomplete | Mapping not yet added to the database | Expect gaps until mappings are added |
| SoA (Activity Instances) card shows Query returned no data | Silent gap — no error is shown | The selected activities are not scheduled (ticked) at any visit in the study's SoA | Schedule the activity at a visit in the SoA, then reopen the report |
If this does not resolve the issue, contact your OpenStudyBuilder administrator.